Monday 24th February 2025: Technical Outlook and Review
 DXY (US Dollar Index):
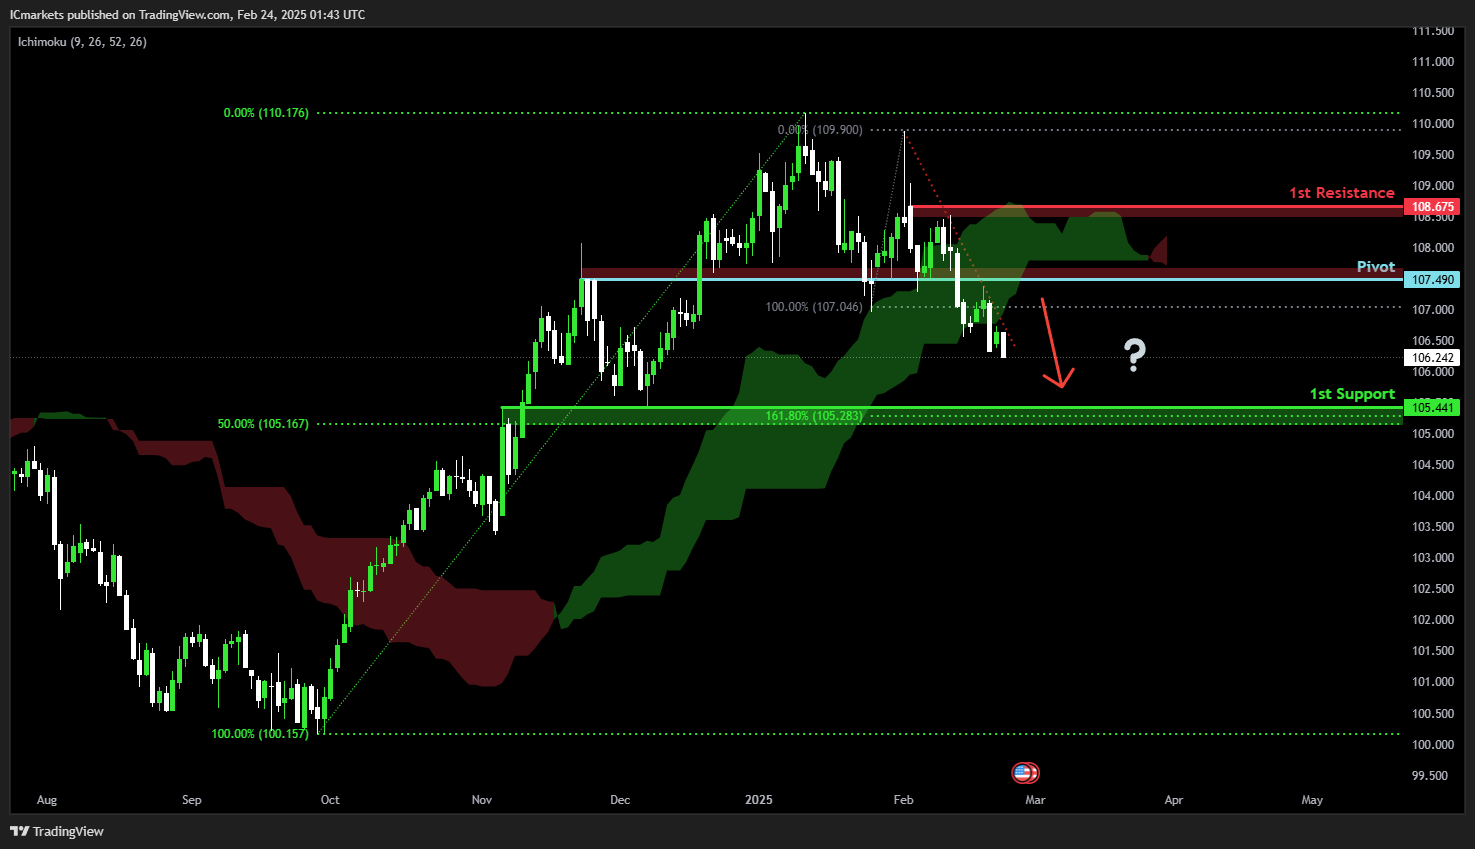
Potential Direction: Bearish
Overall momentum of the chart: Bearish
Price could potentially make a short-term rise toward the pivot before reversing and falling toward the 1st support. Also, price has crossed below the Ichimoku cloud, signaling a shift to the downside.
Pivot: 107.49
Supporting reasons: Identified as an overlap resistance, indicating a potential area where selling pressure could emerge.
1st support: 105.44
Supporting reasons: Identified as an overlap support that aligns with the 50% Fibonacci retracement and the 161.8% Fibonacci extension, forming a strong Fibonacci confluence where price could find support.
1st resistance: 108.67
Supporting reasons: Identified as a swing high resistance, indicating a potential level that could cap further upward movement.
DXY (US Dollar Index):
Potential Direction: Bearish
Overall momentum of the chart: Bearish
Price could potentially make a short-term rise toward the pivot before reversing and falling toward the 1st support. Also, price has crossed below the Ichimoku cloud, signaling a shift to the downside.
Pivot: 107.49
Supporting reasons: Identified as an overlap resistance, indicating a potential area where selling pressure could emerge.
1st support: 105.44
Supporting reasons: Identified as an overlap support that aligns with the 50% Fibonacci retracement and the 161.8% Fibonacci extension, forming a strong Fibonacci confluence where price could find support.
1st resistance: 108.67
Supporting reasons: Identified as a swing high resistance, indicating a potential level that could cap further upward movement.
 EUR/USD:
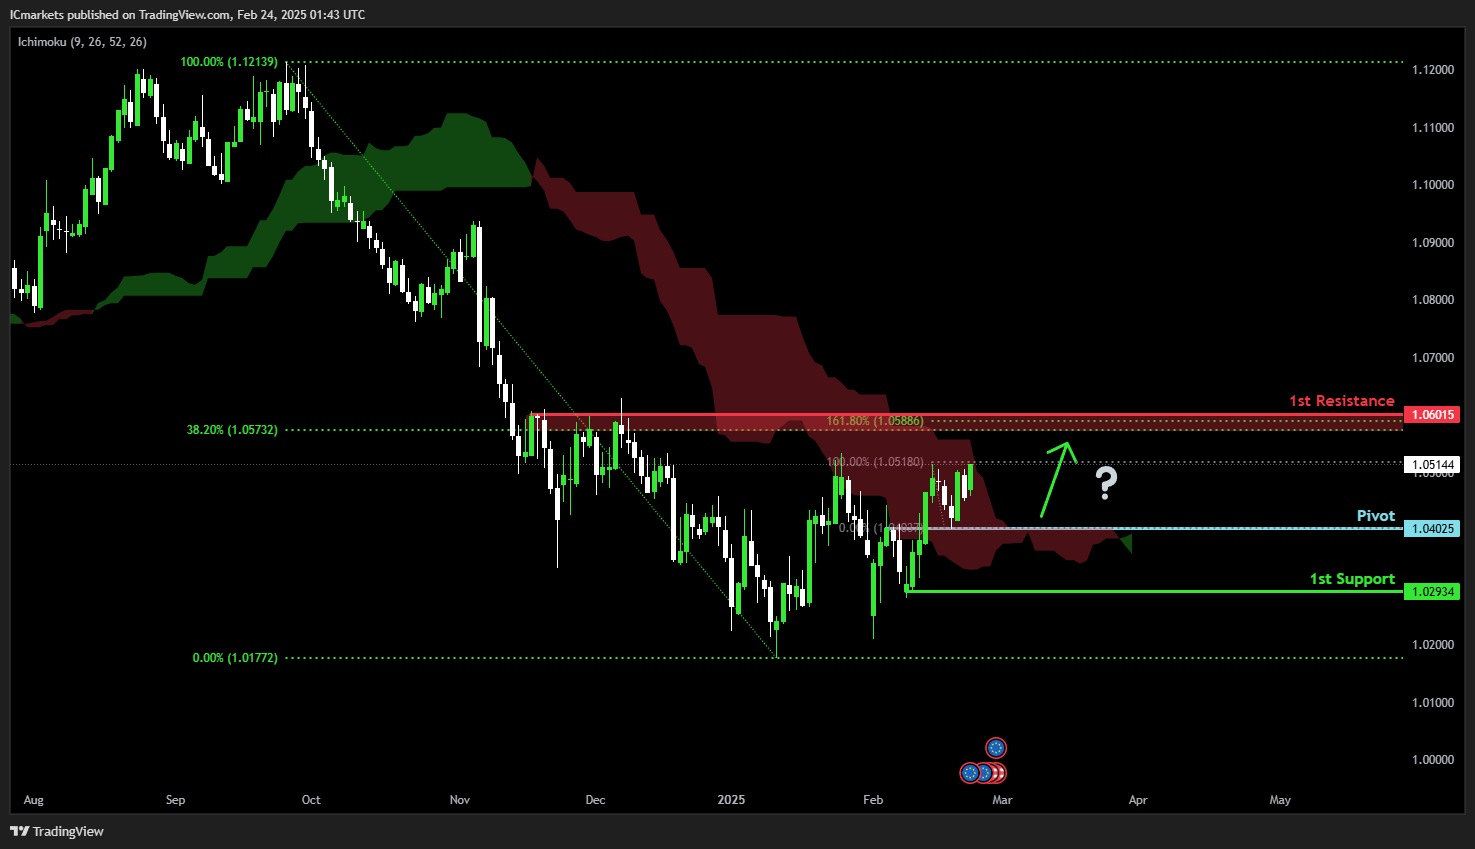
Potential Direction: Bullish
Overall momentum of the chart: Bullish
Price could potentially make a bullish continuation toward the 1st resistance. Also, price has crossed above the Ichimoku cloud, signaling further upside potential.
Pivot: 1.0402
Supporting reasons: Identified as an overlap support, indicating a potential level where buyers could step in.
1st support: 1.0293
Supporting reasons: Identified as a swing low support, indicating as a potential area where price could stabilize before continuing higher.
1st resistance: 1.0601
Supporting reasons: Identified as a swing high resistance that aligns with the 38.2% Fibonacci retracement and the 161.8% Fibonacci extension, forming a Fibonacci confluence that could act as a key resistance level.
EUR/USD:
Potential Direction: Bullish
Overall momentum of the chart: Bullish
Price could potentially make a bullish continuation toward the 1st resistance. Also, price has crossed above the Ichimoku cloud, signaling further upside potential.
Pivot: 1.0402
Supporting reasons: Identified as an overlap support, indicating a potential level where buyers could step in.
1st support: 1.0293
Supporting reasons: Identified as a swing low support, indicating as a potential area where price could stabilize before continuing higher.
1st resistance: 1.0601
Supporting reasons: Identified as a swing high resistance that aligns with the 38.2% Fibonacci retracement and the 161.8% Fibonacci extension, forming a Fibonacci confluence that could act as a key resistance level.
 EUR/JPY:
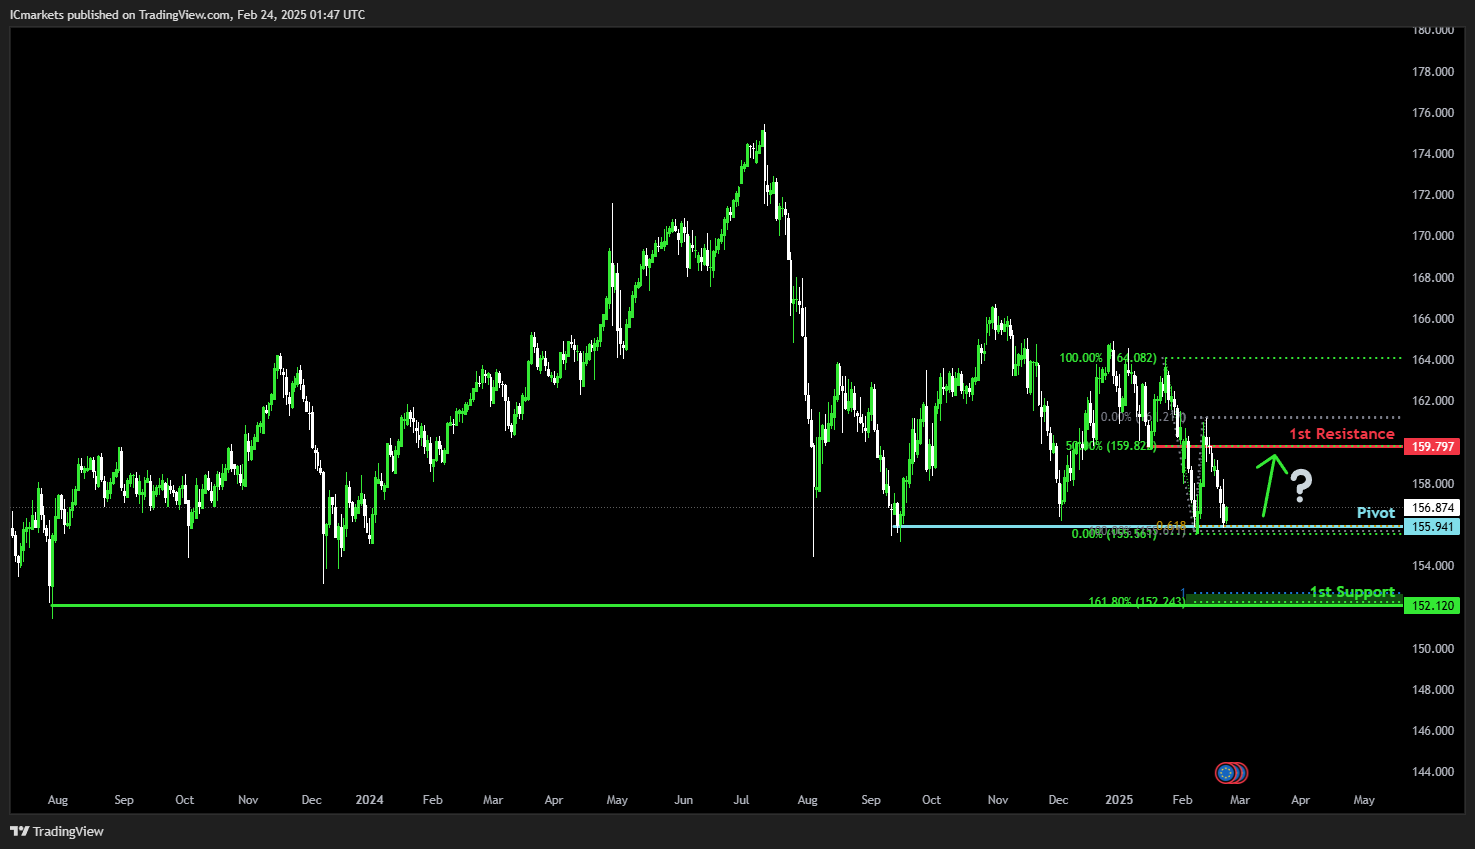
Potential Direction: Bullish
Overall momentum of the chart: Bearish
Price could potentially make a bullish bounce off the pivot and head towards the 1st resistance.
Pivot: 155.94
Supporting reasons: Identified as a multi-swing low support that aligns with the 61.8% Fibonacci projection, indicating a potential area where price could rebound.
1st support: 152.12
Supporting reasons: Identified as a swing low support that aligns with the 161.8% Fibonacci extension and 100% Fibonacci projection, forming a strong Fibonacci confluence where price could find support.
1st resistance: 159.79
Supporting reasons: Identified as an overlap resistance that aligns with the 50% Fibonacci retracement, indicating a potential level where price could face selling pressure.
EUR/JPY:
Potential Direction: Bullish
Overall momentum of the chart: Bearish
Price could potentially make a bullish bounce off the pivot and head towards the 1st resistance.
Pivot: 155.94
Supporting reasons: Identified as a multi-swing low support that aligns with the 61.8% Fibonacci projection, indicating a potential area where price could rebound.
1st support: 152.12
Supporting reasons: Identified as a swing low support that aligns with the 161.8% Fibonacci extension and 100% Fibonacci projection, forming a strong Fibonacci confluence where price could find support.
1st resistance: 159.79
Supporting reasons: Identified as an overlap resistance that aligns with the 50% Fibonacci retracement, indicating a potential level where price could face selling pressure.
 EUR/GBP:
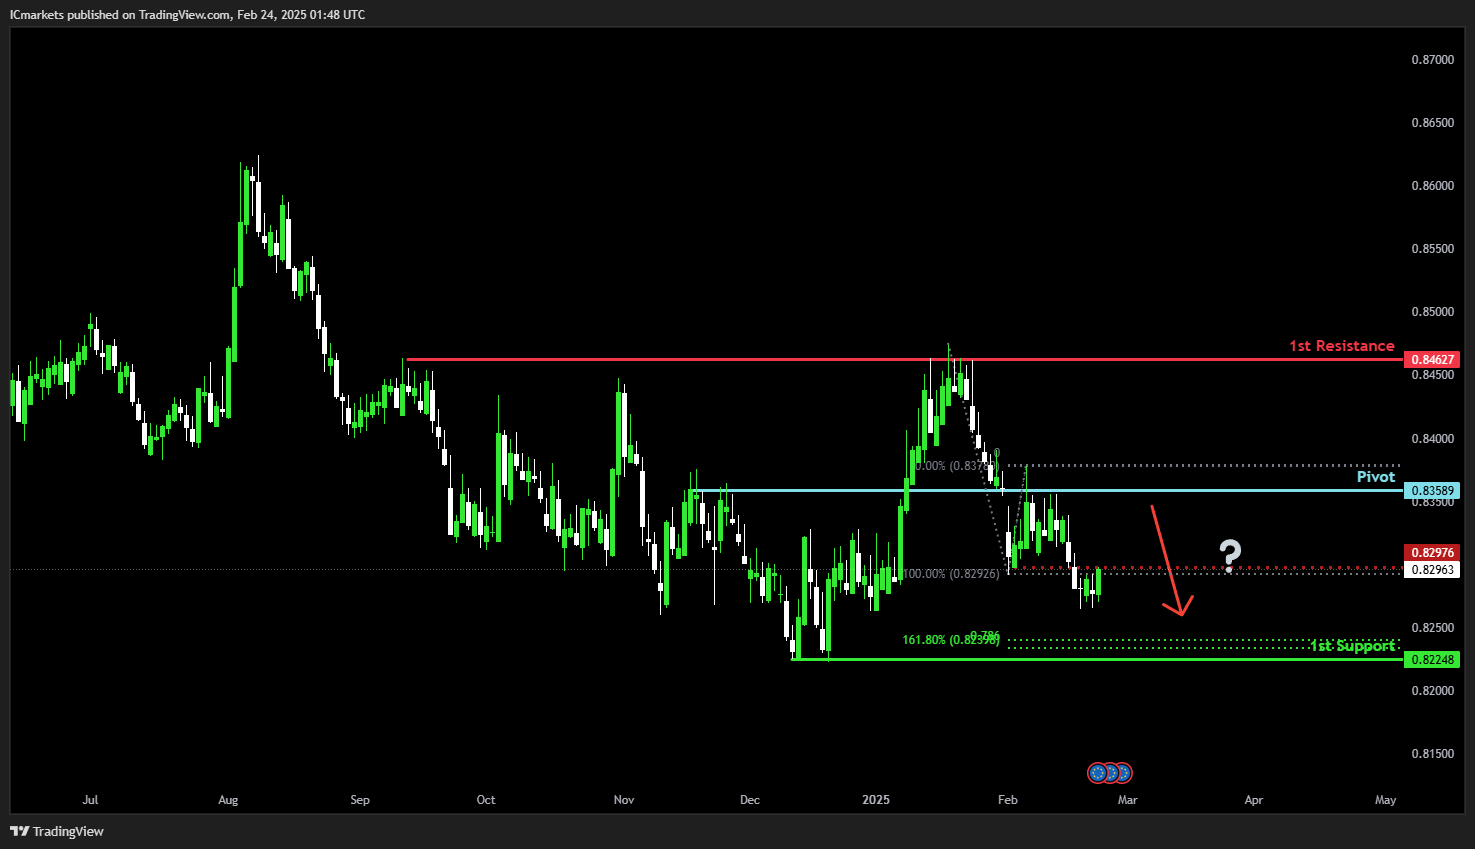
Potential Direction: Bearish
Overall momentum of the chart: Bearish
Price could potentially make a short-term rise toward the pivot before reversing off it and dropping toward the 1st support.
Pivot: 0.8358
Supporting reasons: Identified as an overlap resistance, indicating a potential area where selling pressure could emerge.
1st support: 0.8224
Supporting reasons: Identified as a multi-swing low support that aligns with the 161.8% Fibonacci extension and 78.6% Fibonacci projection, forming a strong Fibonacci confluence where price could find support.
1st resistance: 0.8462
Supporting reasons: Identified as a multi-swing high resistance, indicating a potential level that could cap further upward movement.
EUR/GBP:
Potential Direction: Bearish
Overall momentum of the chart: Bearish
Price could potentially make a short-term rise toward the pivot before reversing off it and dropping toward the 1st support.
Pivot: 0.8358
Supporting reasons: Identified as an overlap resistance, indicating a potential area where selling pressure could emerge.
1st support: 0.8224
Supporting reasons: Identified as a multi-swing low support that aligns with the 161.8% Fibonacci extension and 78.6% Fibonacci projection, forming a strong Fibonacci confluence where price could find support.
1st resistance: 0.8462
Supporting reasons: Identified as a multi-swing high resistance, indicating a potential level that could cap further upward movement.
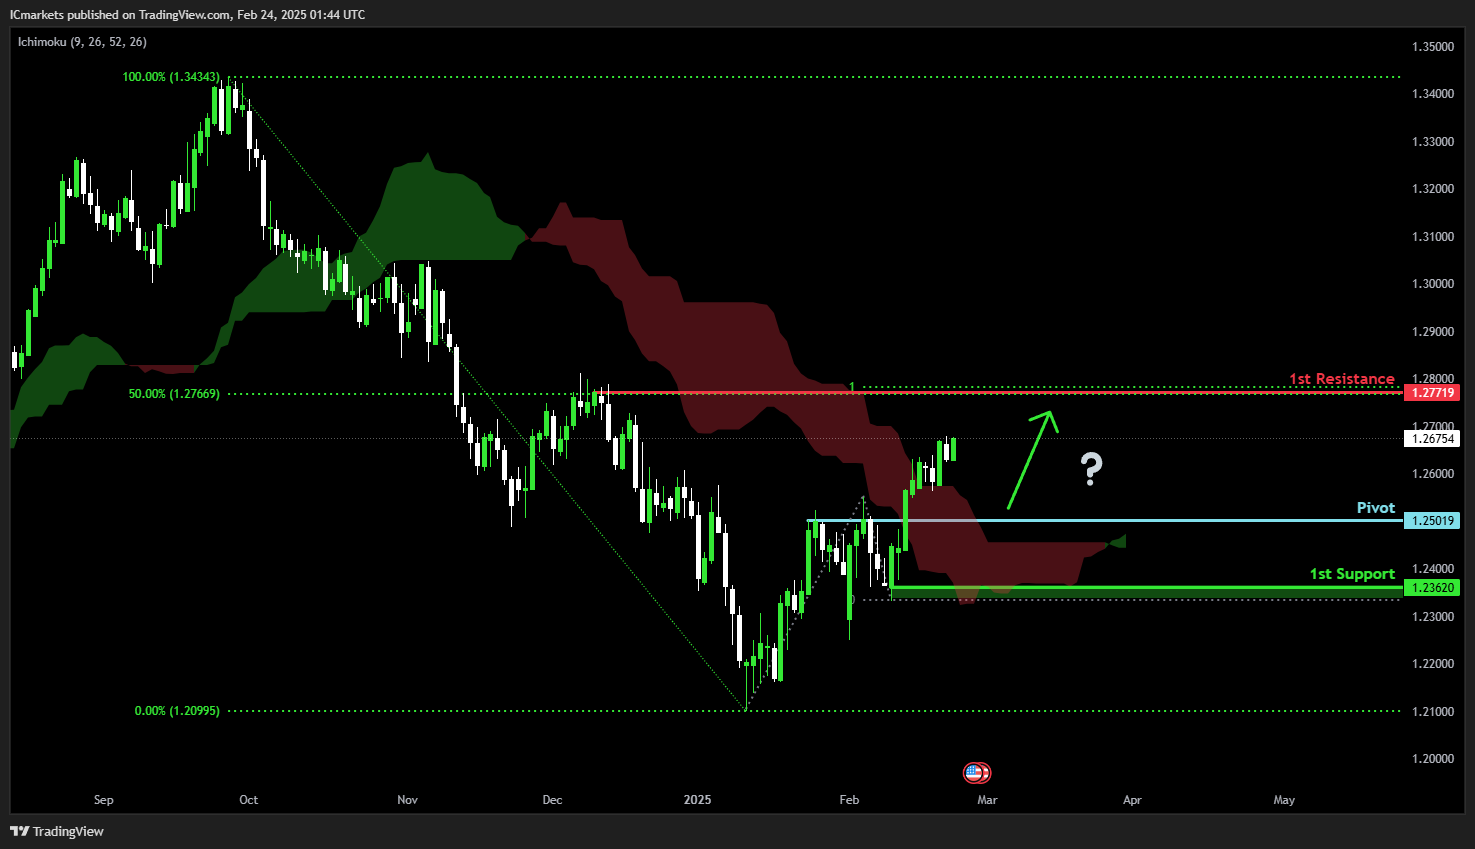
 GBP/USD:
Potential Direction: Bullish
Overall momentum of the chart: Bullish
Factors contributing to the momentum: Price has crossed above the Ichimoku cloud, signaling further upside potential.
Price could potentially drop further to the pivot in the short term before bouncing from there and rising to the 1st resistance.
Pivot: 1.2501
Supporting reasons: Identified as a pullback support, indicating a potential area where buyers could step in.
1st support: 1.2362
Supporting reasons: Identified as a swing low support, acting as a potential level where price could stabilize before continuing higher.
1st resistance: 1.2771
Supporting reasons: Identified as a multi-swing high resistance that aligns with the 100% Fibonacci projection and 50% Fibonacci retracement, forming a Fibonacci confluence that could act as a key resistance level.
GBP/USD:
Potential Direction: Bullish
Overall momentum of the chart: Bullish
Factors contributing to the momentum: Price has crossed above the Ichimoku cloud, signaling further upside potential.
Price could potentially drop further to the pivot in the short term before bouncing from there and rising to the 1st resistance.
Pivot: 1.2501
Supporting reasons: Identified as a pullback support, indicating a potential area where buyers could step in.
1st support: 1.2362
Supporting reasons: Identified as a swing low support, acting as a potential level where price could stabilize before continuing higher.
1st resistance: 1.2771
Supporting reasons: Identified as a multi-swing high resistance that aligns with the 100% Fibonacci projection and 50% Fibonacci retracement, forming a Fibonacci confluence that could act as a key resistance level.
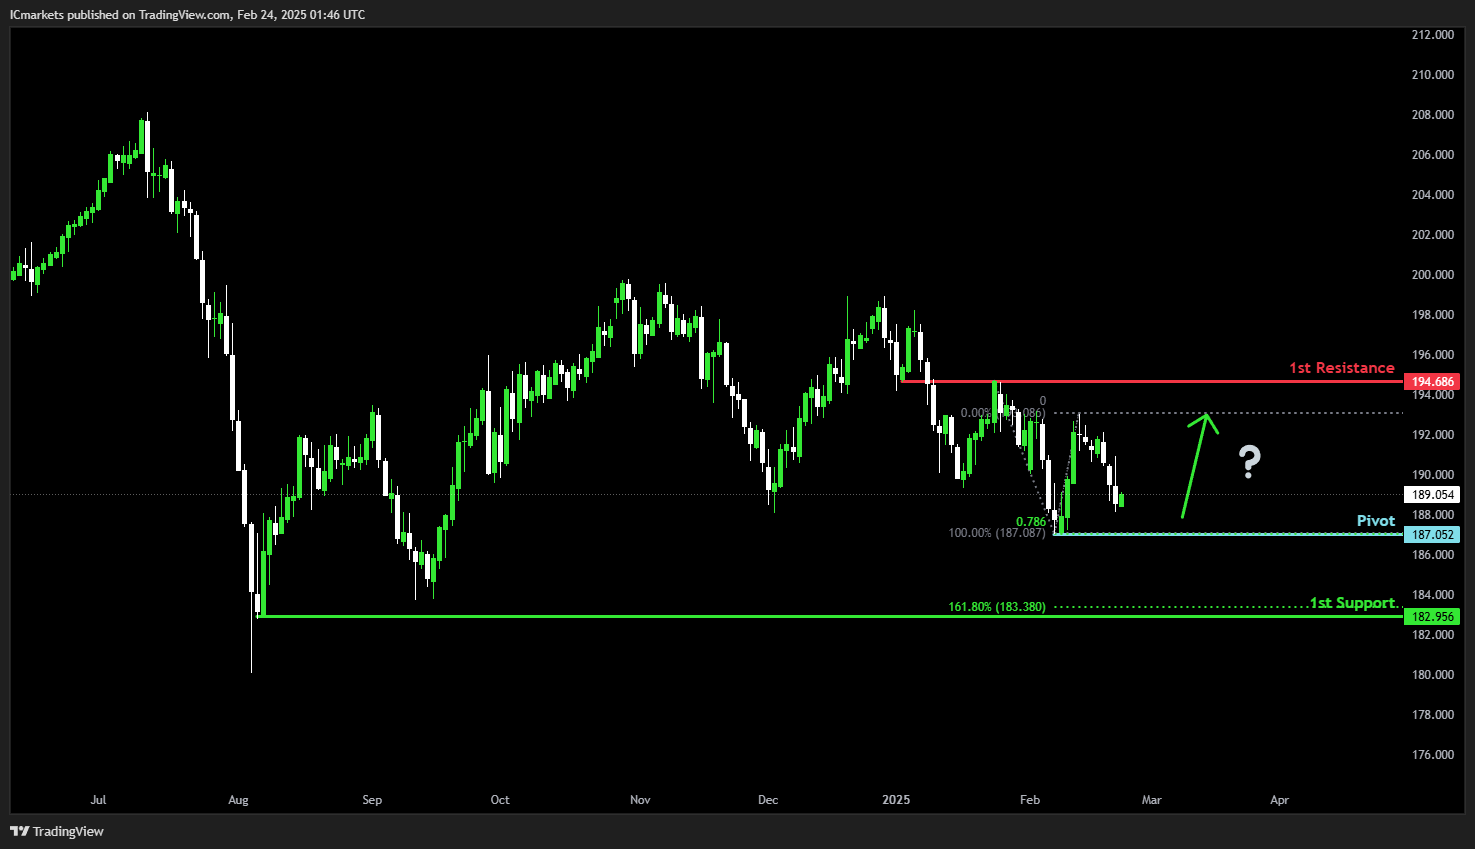
 GBP/JPY:
Potential Direction: Bullish
Overall momentum of the chart: Bullish
Price could potentially drop further to the pivot in the short term before bouncing from there and rising to the 1st resistance.
Pivot: 187.05
Supporting reasons: Identified as a swing low support that aligns with the 78.6% Fibonacci projection, indicating a potential area where buyers could step in.
1st support: 182.95
Supporting reasons: Identified as a swing low support that aligns with the 161.8% Fibonacci extension, indicating a potential level where price could stabilize before continuing higher.
1st resistance: 194.68
Supporting reasons: Identified as an overlap resistance, indicating a potential level where price could face selling pressure.
GBP/JPY:
Potential Direction: Bullish
Overall momentum of the chart: Bullish
Price could potentially drop further to the pivot in the short term before bouncing from there and rising to the 1st resistance.
Pivot: 187.05
Supporting reasons: Identified as a swing low support that aligns with the 78.6% Fibonacci projection, indicating a potential area where buyers could step in.
1st support: 182.95
Supporting reasons: Identified as a swing low support that aligns with the 161.8% Fibonacci extension, indicating a potential level where price could stabilize before continuing higher.
1st resistance: 194.68
Supporting reasons: Identified as an overlap resistance, indicating a potential level where price could face selling pressure.
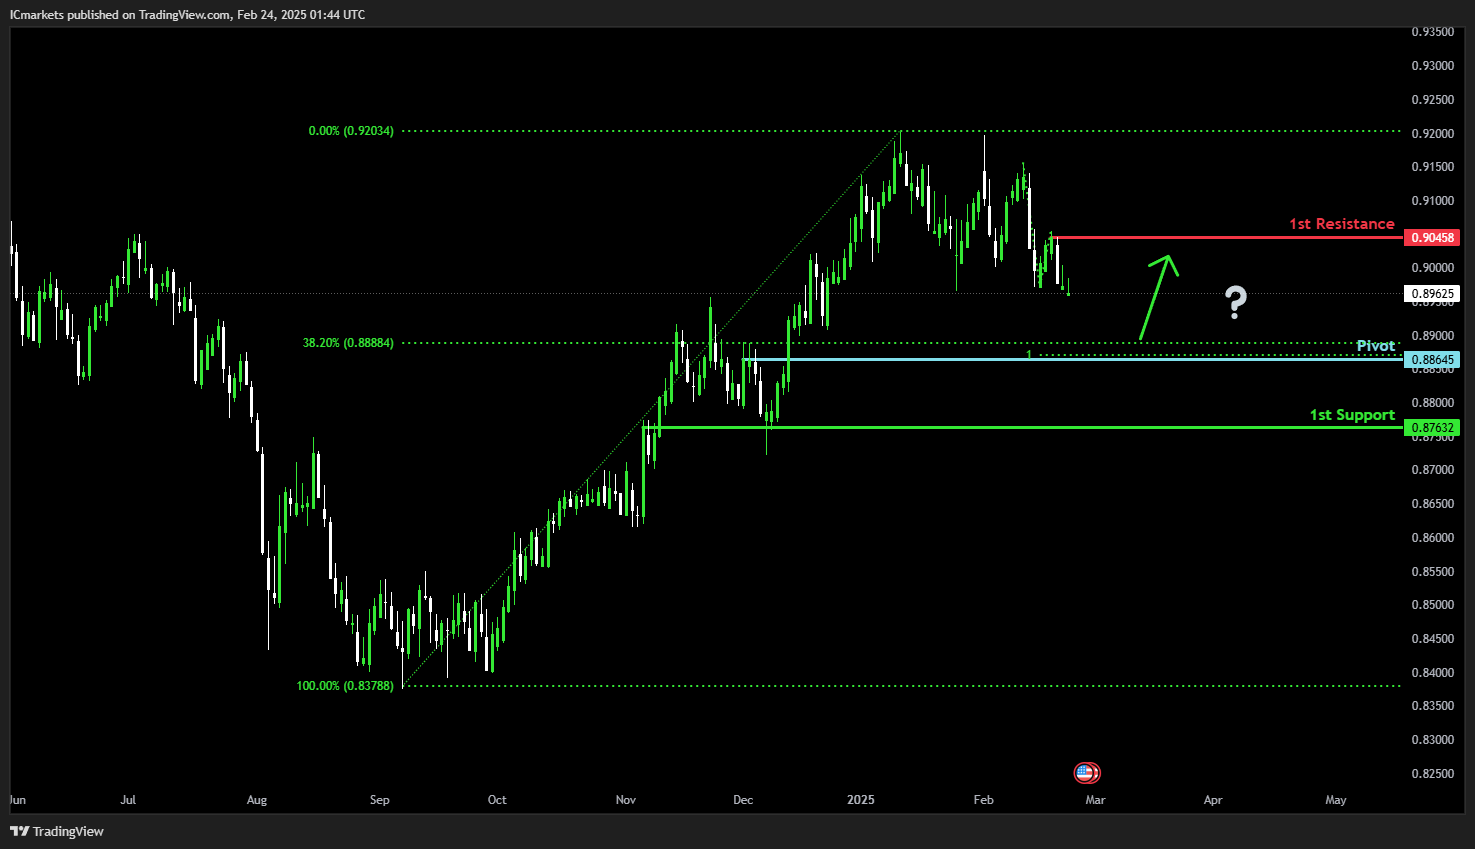
 USD/CHF:
Potential Direction: Bullish
Overall momentum of the chart: Bullish
Price could potentially drop further to the pivot in the short term before bouncing from there and rising to the 1st resistance.
Pivot: 0.8864
Supporting reasons: Identified as a pullback support that aligns with the 38.2% Fibonacci retracement and 100% Fibonacci projection, forming a strong Fibonacci confluence where price could find support.
1st support: 0.8763
Supporting reasons: Identified as an overlap support, indicating a potential level where price could stabilize before continuing higher.
1st resistance: 0.9045
Supporting reasons: Identified as a swing high resistance, indicating a potential level where price could face selling pressure.
USD/CHF:
Potential Direction: Bullish
Overall momentum of the chart: Bullish
Price could potentially drop further to the pivot in the short term before bouncing from there and rising to the 1st resistance.
Pivot: 0.8864
Supporting reasons: Identified as a pullback support that aligns with the 38.2% Fibonacci retracement and 100% Fibonacci projection, forming a strong Fibonacci confluence where price could find support.
1st support: 0.8763
Supporting reasons: Identified as an overlap support, indicating a potential level where price could stabilize before continuing higher.
1st resistance: 0.9045
Supporting reasons: Identified as a swing high resistance, indicating a potential level where price could face selling pressure.
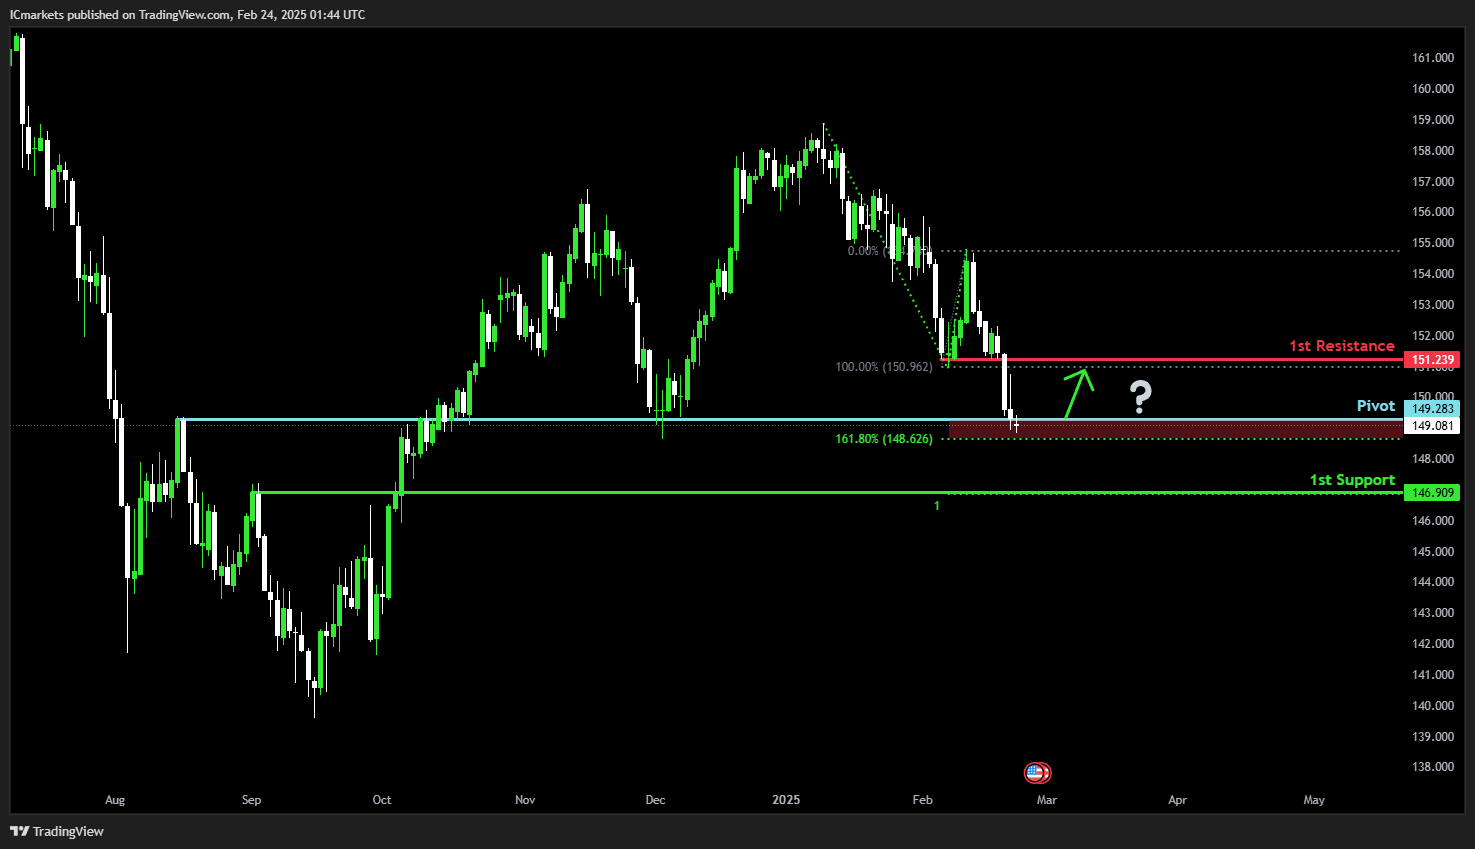
 USD/JPY:
Potential Direction: Bullish
Overall momentum of the chart: Bullish
Price could potentially make a bullish bounce off the pivot and head towards the 1st resistance.
Pivot: 149.28
Supporting reasons: Identified as a pullback support that aligns with the 161.8% Fibonacci extension, indicating a strong level where buyers could step in.
1st support: 146.90
Supporting reasons: Identified as a pullback support that aligns with the 100% Fibonacci projection, suggesting a potential area where price could stabilize before resuming its upward movement.
1st resistance: 151.23
Supporting reasons: Identified as a pullback resistance, indicating a potential level where price could face selling pressure.
USD/JPY:
Potential Direction: Bullish
Overall momentum of the chart: Bullish
Price could potentially make a bullish bounce off the pivot and head towards the 1st resistance.
Pivot: 149.28
Supporting reasons: Identified as a pullback support that aligns with the 161.8% Fibonacci extension, indicating a strong level where buyers could step in.
1st support: 146.90
Supporting reasons: Identified as a pullback support that aligns with the 100% Fibonacci projection, suggesting a potential area where price could stabilize before resuming its upward movement.
1st resistance: 151.23
Supporting reasons: Identified as a pullback resistance, indicating a potential level where price could face selling pressure.
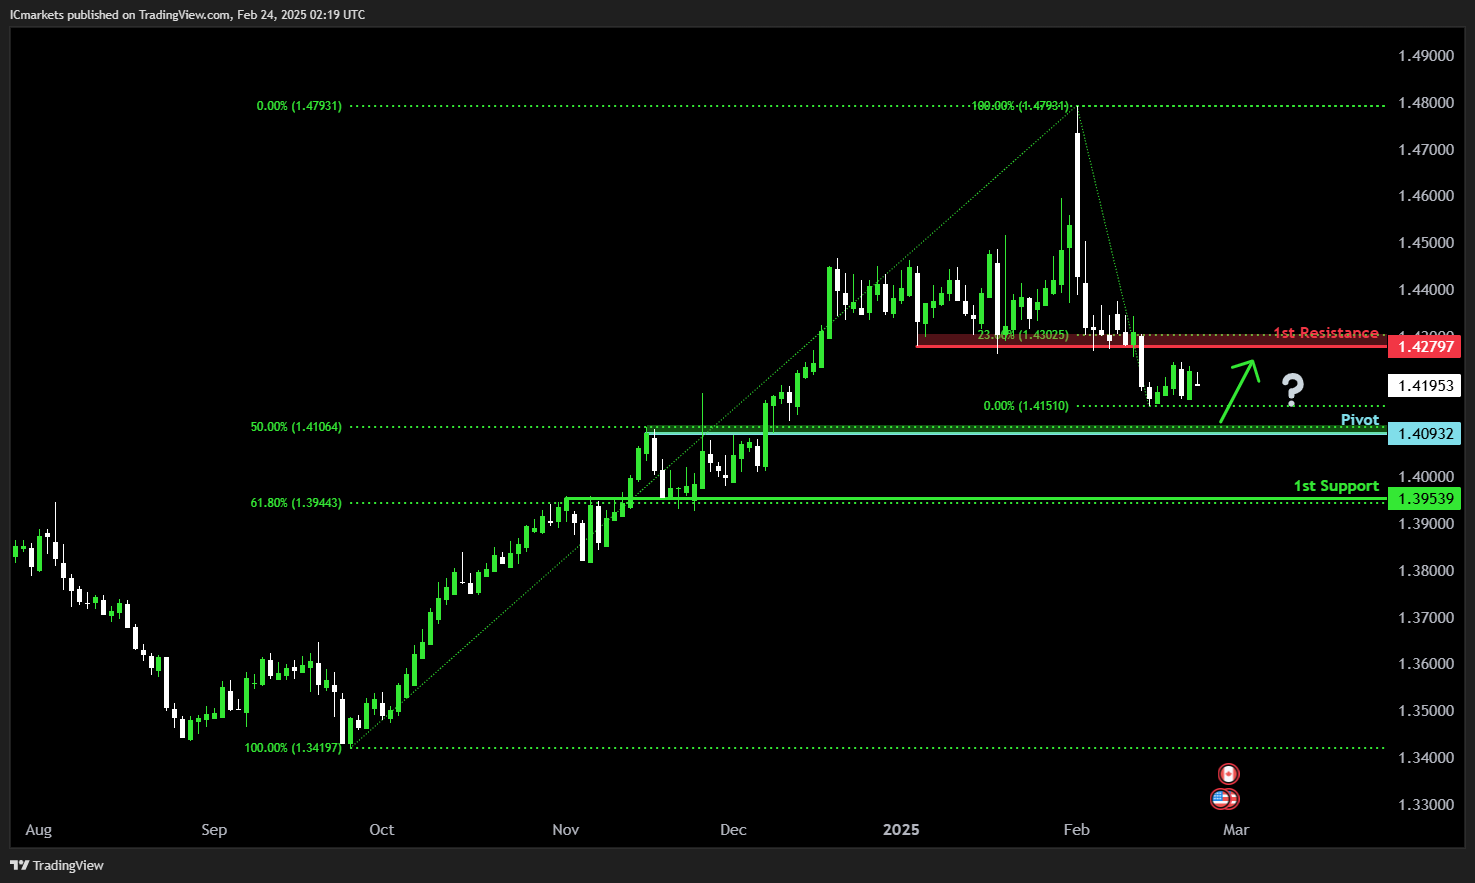
 USD/CAD:
Potential Direction: Bullish
Overall momentum of the chart: Bearish
Price could fall towards the pivot and potentially make a bullish bounce off this level to rise towards the 1st resistance.
Pivot: 1.4093
Supporting reasons: Identified as a pullback support that aligns with a 50% Fibonacci retracement, indicating a potential area where buying interests could pick up to stage a minor rebound.
1st support: 1.3953
Supporting reasons: Identified as an overlap support that aligns with a 61.8% Fibonacci retracement, indicating a key level where the price could stabilize once more.
1st resistance: 1.4279
Supporting reasons: Identified as a pullback resistance that aligns close to a 23.6% Fibonacci retracement, indicating a potential area that could halt any further upward movement.
USD/CAD:
Potential Direction: Bullish
Overall momentum of the chart: Bearish
Price could fall towards the pivot and potentially make a bullish bounce off this level to rise towards the 1st resistance.
Pivot: 1.4093
Supporting reasons: Identified as a pullback support that aligns with a 50% Fibonacci retracement, indicating a potential area where buying interests could pick up to stage a minor rebound.
1st support: 1.3953
Supporting reasons: Identified as an overlap support that aligns with a 61.8% Fibonacci retracement, indicating a key level where the price could stabilize once more.
1st resistance: 1.4279
Supporting reasons: Identified as a pullback resistance that aligns close to a 23.6% Fibonacci retracement, indicating a potential area that could halt any further upward movement.
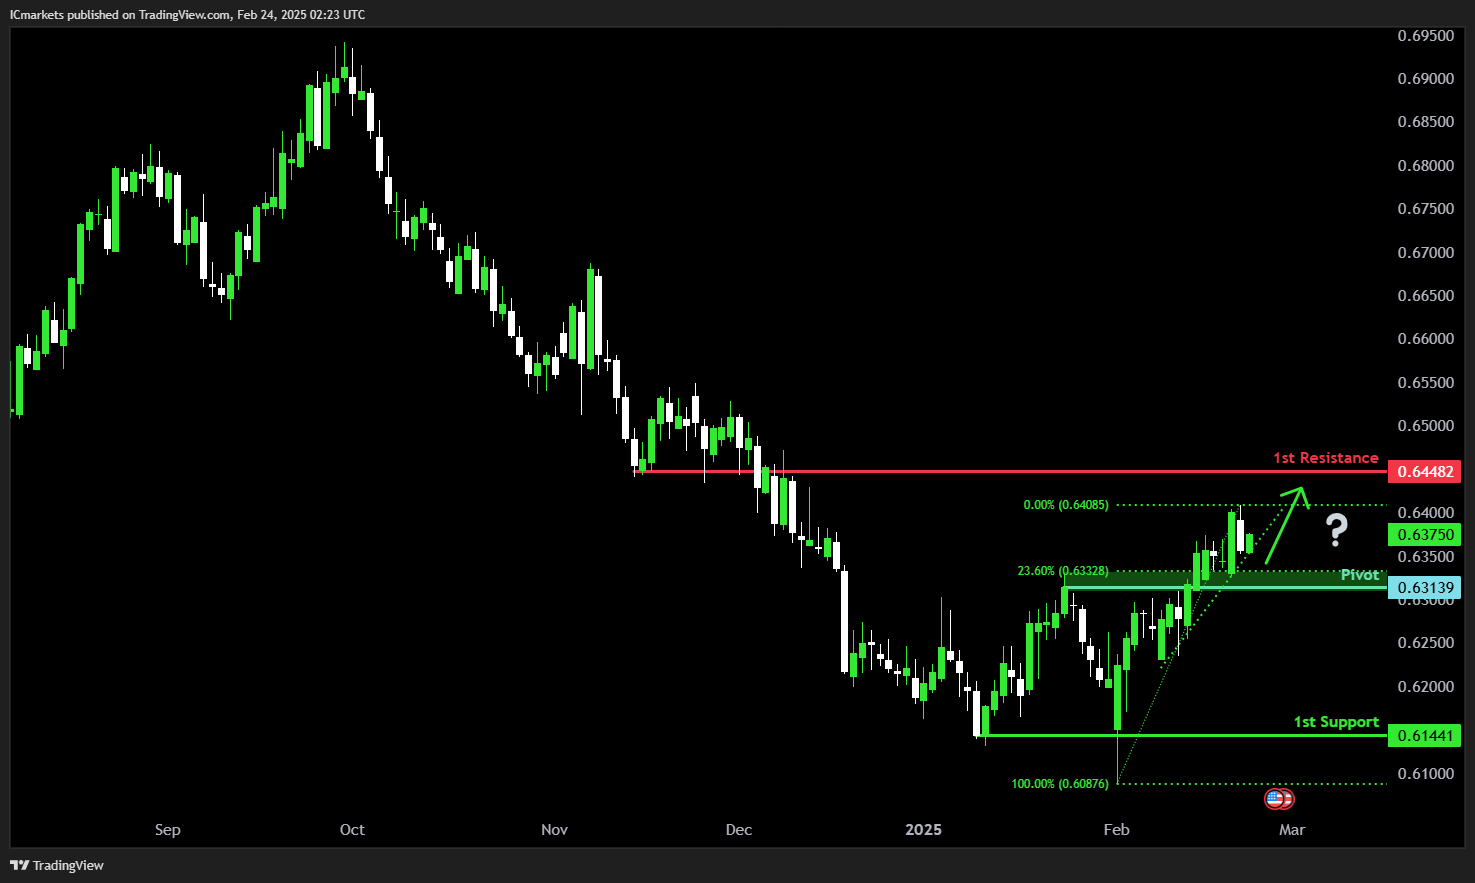
 AUD/USD:
Potential Direction: Bullish
Overall momentum of the chart: Bullish
Price could fall towards the pivot and potentially make a bullish bounce off this level to rise towards the 1st resistance.
Pivot: 0.6313
Supporting reasons: Identified as a pullback support that aligns close to a 23.6% Fibonacci retracement, indicating a potential area where buying interests could pick up to resume the uptrend.
1st support: 0.6144
Supporting reasons: Identified as a multi-swing-low support, suggesting a potential area where the price could stabilize once again.
1st resistance: 0.6448
Supporting reasons: Identified as an overlap resistance, indicating a potential area that could halt any further upward movement.
AUD/USD:
Potential Direction: Bullish
Overall momentum of the chart: Bullish
Price could fall towards the pivot and potentially make a bullish bounce off this level to rise towards the 1st resistance.
Pivot: 0.6313
Supporting reasons: Identified as a pullback support that aligns close to a 23.6% Fibonacci retracement, indicating a potential area where buying interests could pick up to resume the uptrend.
1st support: 0.6144
Supporting reasons: Identified as a multi-swing-low support, suggesting a potential area where the price could stabilize once again.
1st resistance: 0.6448
Supporting reasons: Identified as an overlap resistance, indicating a potential area that could halt any further upward movement.
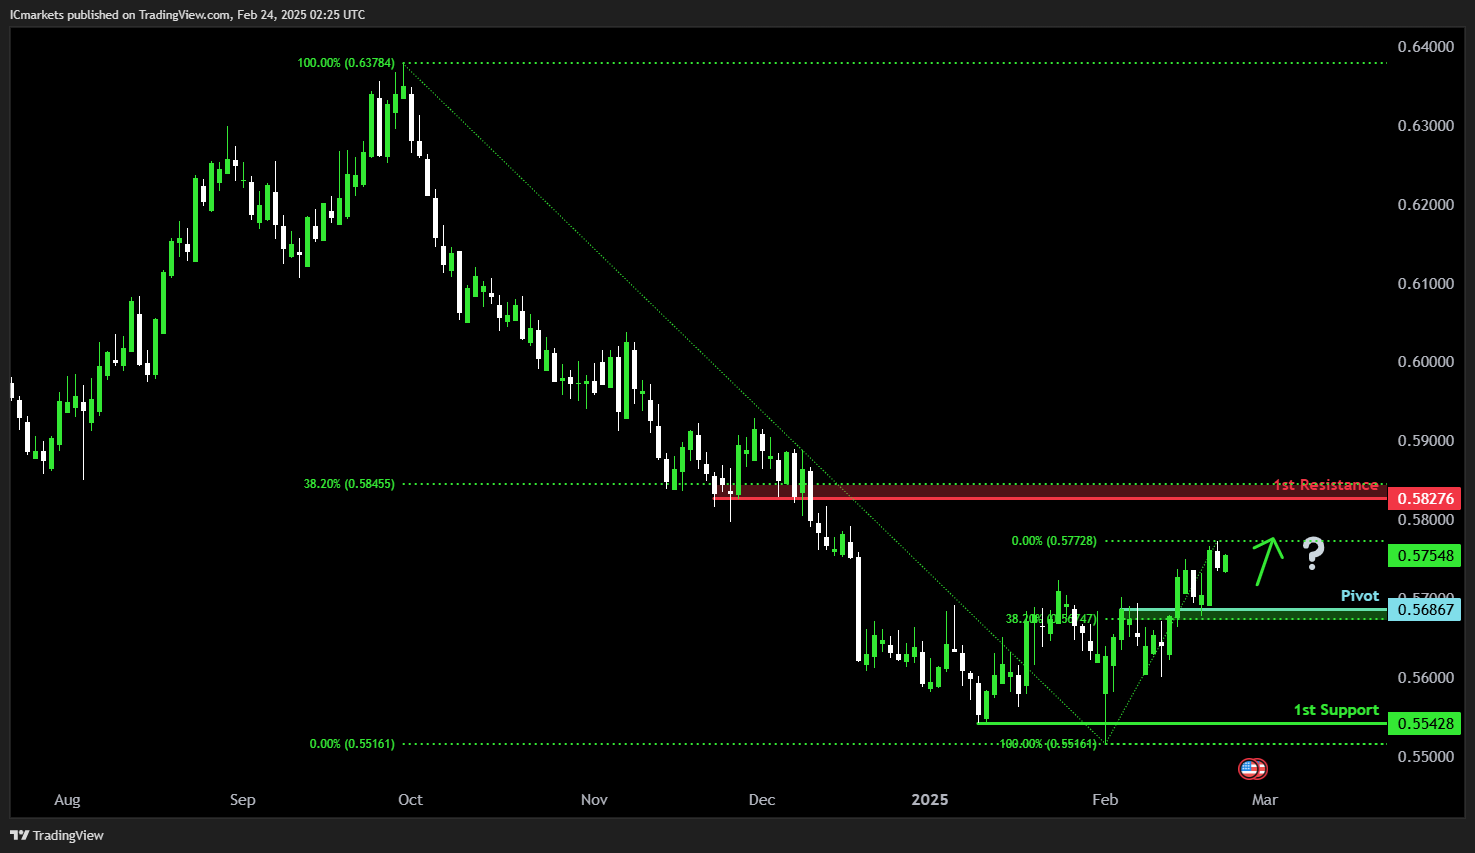
 NZD/USD
Potential Direction: Bullish
Overall momentum of the chart: Bullish
Price could fall towards the pivot and potentially make a bullish bounce off this level to rise towards the 1st resistance.
Pivot: 0.5686
Supporting reasons: Identified as an overlap support that aligns close to a 38.2% Fibonacci retracement, indicating a potential area where buying interests could pick up to resume the uptrend.
1st support: 0.5542
Supporting reasons: Identified as a multi-swing-low support, suggesting a potential area where the price could stabilize once more.
1st resistance: 0.5827
Supporting reasons: Identified as a pullback resistance that aligns close to a 38.2% Fibonacci retracement, indicating a potential area that could halt any further upward movement.
NZD/USD
Potential Direction: Bullish
Overall momentum of the chart: Bullish
Price could fall towards the pivot and potentially make a bullish bounce off this level to rise towards the 1st resistance.
Pivot: 0.5686
Supporting reasons: Identified as an overlap support that aligns close to a 38.2% Fibonacci retracement, indicating a potential area where buying interests could pick up to resume the uptrend.
1st support: 0.5542
Supporting reasons: Identified as a multi-swing-low support, suggesting a potential area where the price could stabilize once more.
1st resistance: 0.5827
Supporting reasons: Identified as a pullback resistance that aligns close to a 38.2% Fibonacci retracement, indicating a potential area that could halt any further upward movement.
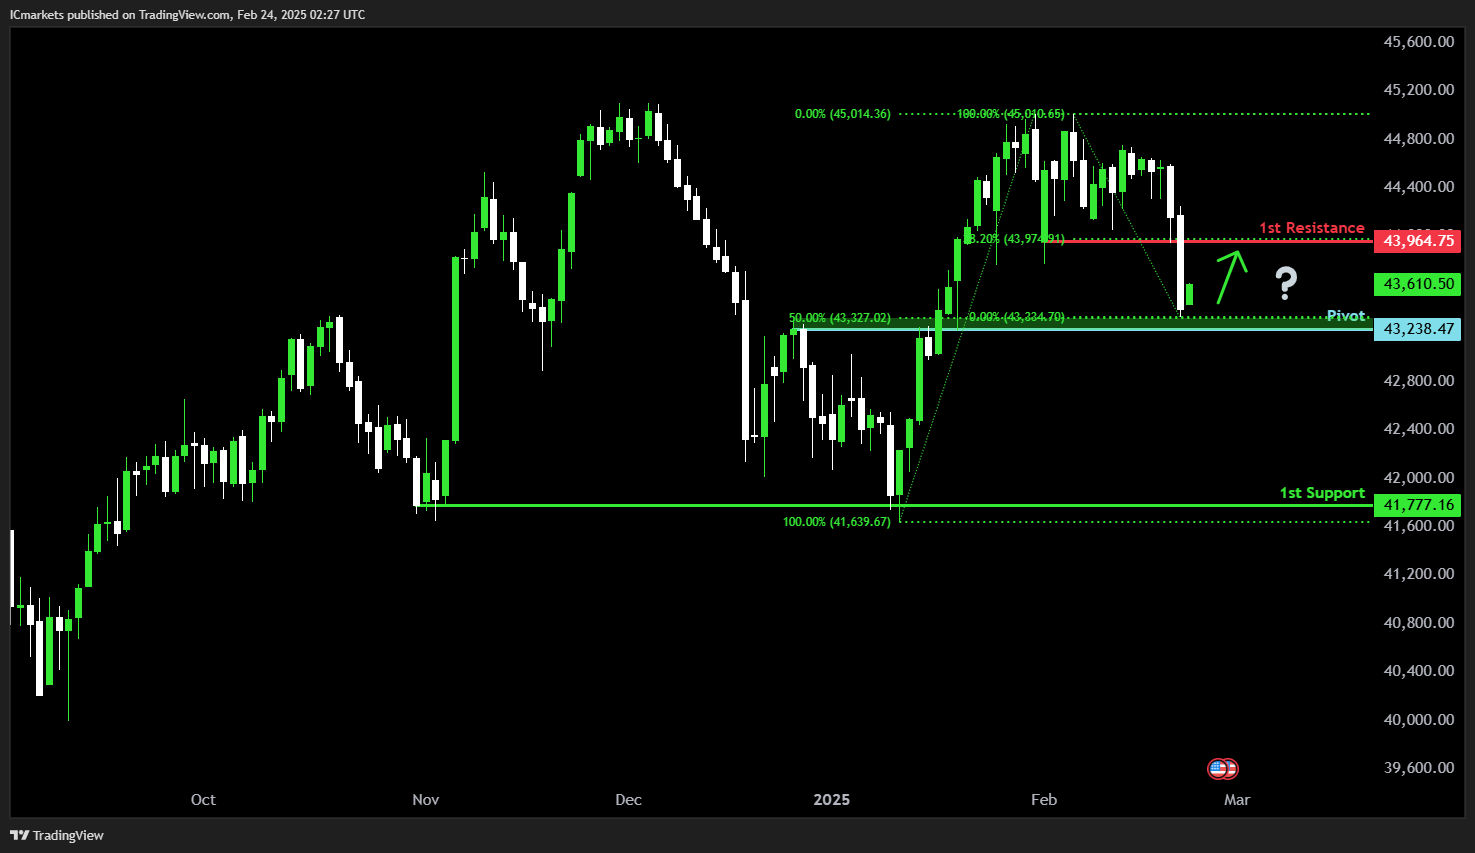
 US30 (DJIA):
Potential Direction: Bullish
Overall momentum of the chart: Neutral
Price could fall towards the pivot and potentially make a bullish bounce off this level to rise towards the 1st resistance.
Pivot: 43,238.47
Supporting reasons: Identified as a pullback support that aligns close to a 50% Fibonacci retracement, indicating a potential area where buying interests could pick up to stage a rebound.
1st support: 41,777.16
Supporting reasons: Identified as a multi-swing-low support, indicating a potential level where the price could stabilize once again.
1st resistance: 43,964.75
Supporting reasons: Identified as a pullback resistance that aligns with a 38.2% Fibonacci retracement, indicating a potential area that could halt any further upward movement.
US30 (DJIA):
Potential Direction: Bullish
Overall momentum of the chart: Neutral
Price could fall towards the pivot and potentially make a bullish bounce off this level to rise towards the 1st resistance.
Pivot: 43,238.47
Supporting reasons: Identified as a pullback support that aligns close to a 50% Fibonacci retracement, indicating a potential area where buying interests could pick up to stage a rebound.
1st support: 41,777.16
Supporting reasons: Identified as a multi-swing-low support, indicating a potential level where the price could stabilize once again.
1st resistance: 43,964.75
Supporting reasons: Identified as a pullback resistance that aligns with a 38.2% Fibonacci retracement, indicating a potential area that could halt any further upward movement.
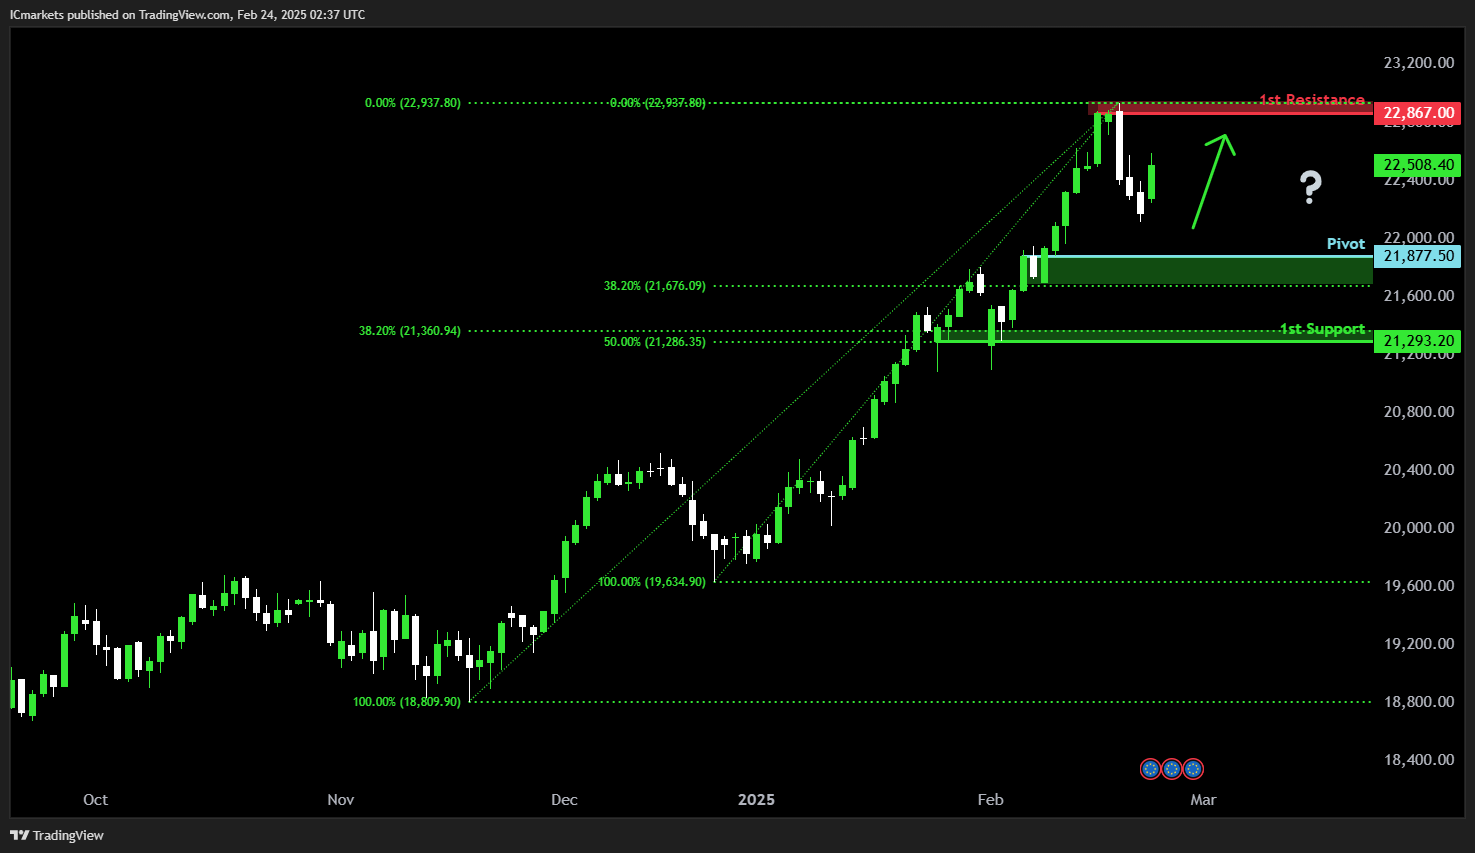
 DE40 (DAX):
Potential Direction: Bullish
Overall momentum of the chart: Bullish
Price could fall towards the pivot and potentially make a bullish bounce off this level to rise towards the 1st resistance.
Pivot: 21,877.50
Supporting reasons: Identified as a pullback support that aligns close to a 38.2% Fibonacci retracement, indicating a potential area where buying interests could pick up to resume the uptrend.
1st support: 21,293.20
Supporting reasons: Identified as a multi-swing-low support that aligns with a confluence of Fibonacci levels i.e. the 38.2% and 50% retracements, indicating a key level where the price could stabilize once more.
1st resistance: 22,867.00
Supporting reasons: Identified as a swing-high resistance that aligns close to the all-time high, indicating a potential area that could halt any further upward movement.
DE40 (DAX):
Potential Direction: Bullish
Overall momentum of the chart: Bullish
Price could fall towards the pivot and potentially make a bullish bounce off this level to rise towards the 1st resistance.
Pivot: 21,877.50
Supporting reasons: Identified as a pullback support that aligns close to a 38.2% Fibonacci retracement, indicating a potential area where buying interests could pick up to resume the uptrend.
1st support: 21,293.20
Supporting reasons: Identified as a multi-swing-low support that aligns with a confluence of Fibonacci levels i.e. the 38.2% and 50% retracements, indicating a key level where the price could stabilize once more.
1st resistance: 22,867.00
Supporting reasons: Identified as a swing-high resistance that aligns close to the all-time high, indicating a potential area that could halt any further upward movement.
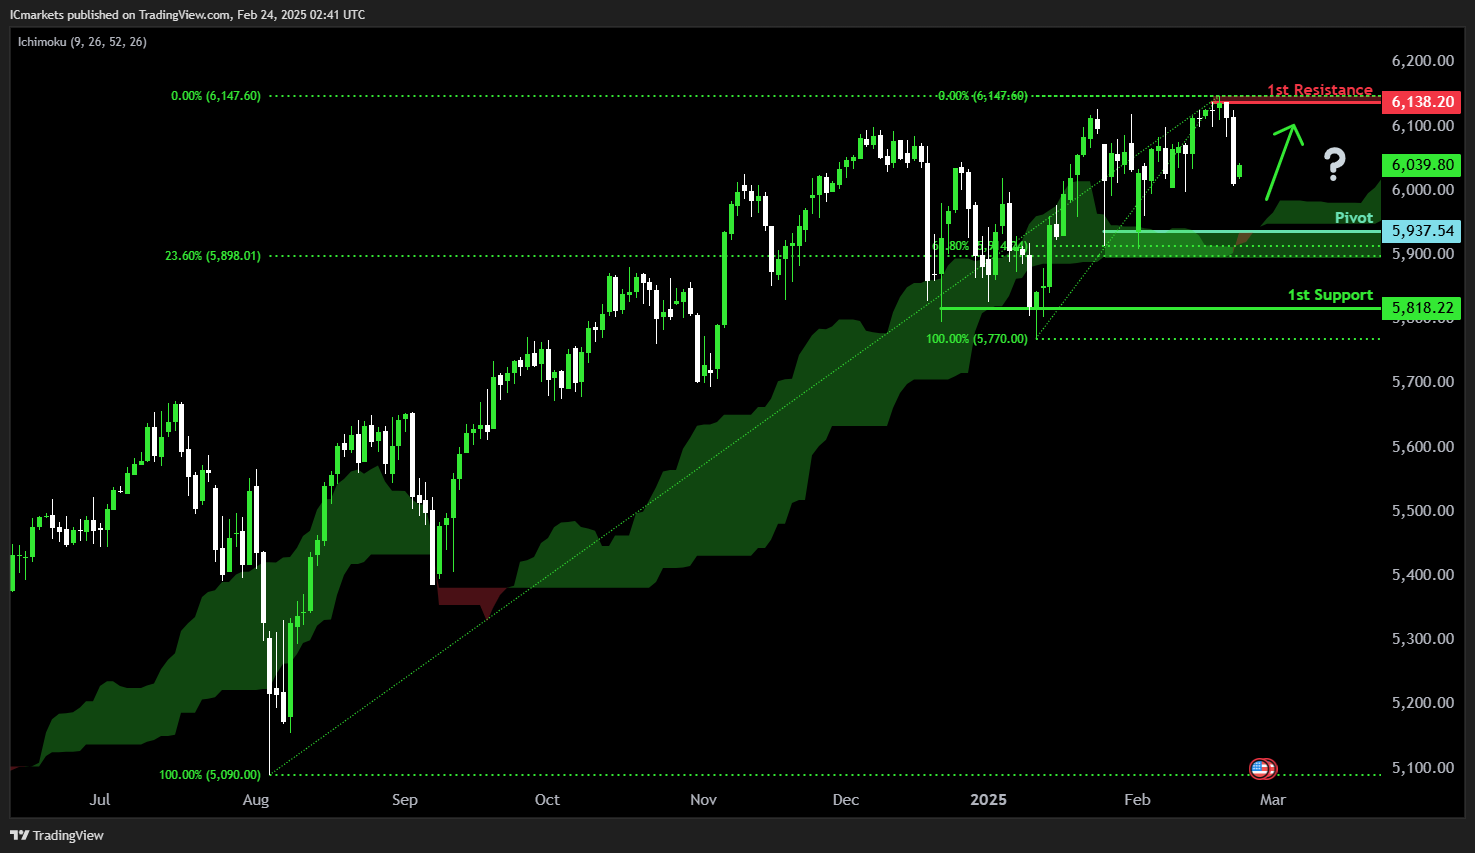
 US500 (S&P 500):
Potential Direction: Bullish
Overall momentum of the chart: Neutral
Price could fall towards the pivot and potentially make a bullish bounce off this level to rise towards the 1st resistance.
Pivot: 5,937.54
Supporting reasons: Identified as a multi-swing-low support that aligns with a confluence of Fibonacci levels i.e. the 23.6% and 61.8% retracements, indicating a potential level where buying interests could pick up to resume the uptrend. The presence of the green Ichimoku Cloud adds further significance to the strength of the bullish momentum.
1st support: 5,818.22
Supporting reasons: Identified as a multi-swing-low support, indicating a potential level where the price could stabilize once again.
1st resistance: 6,138.20
Supporting reasons: Identified as a swing-high resistance that aligns close to the all-time high, indicating a potential area that could halt any further upward movement.
US500 (S&P 500):
Potential Direction: Bullish
Overall momentum of the chart: Neutral
Price could fall towards the pivot and potentially make a bullish bounce off this level to rise towards the 1st resistance.
Pivot: 5,937.54
Supporting reasons: Identified as a multi-swing-low support that aligns with a confluence of Fibonacci levels i.e. the 23.6% and 61.8% retracements, indicating a potential level where buying interests could pick up to resume the uptrend. The presence of the green Ichimoku Cloud adds further significance to the strength of the bullish momentum.
1st support: 5,818.22
Supporting reasons: Identified as a multi-swing-low support, indicating a potential level where the price could stabilize once again.
1st resistance: 6,138.20
Supporting reasons: Identified as a swing-high resistance that aligns close to the all-time high, indicating a potential area that could halt any further upward movement.
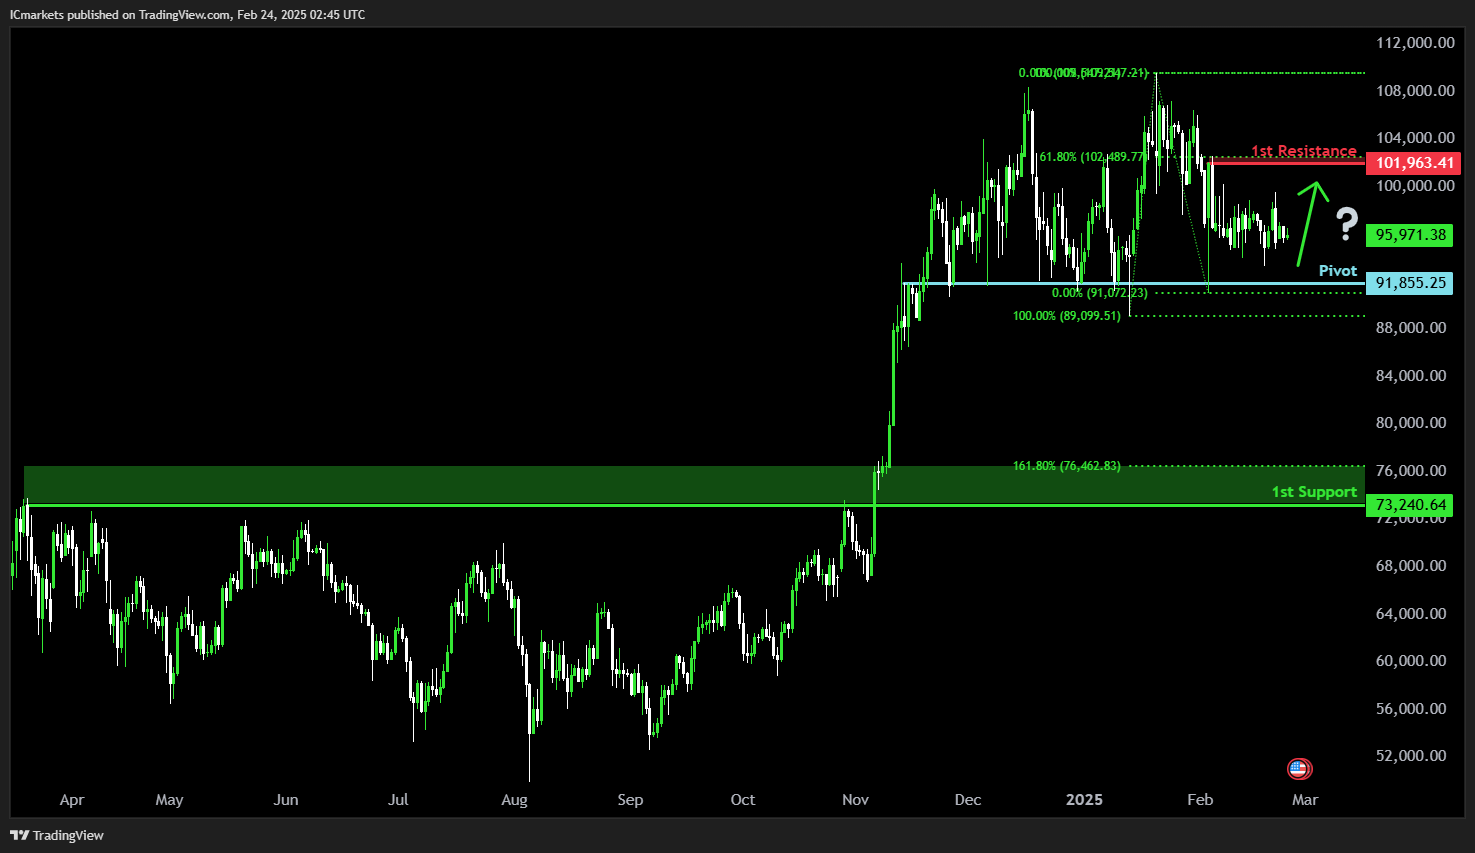
 BTC/USD (Bitcoin):
Potential Direction: Bullish
Overall momentum of the chart: Neutral
Price could fall towards the pivot and potentially make a bullish bounce off this level to rise towards the 1st resistance.
Pivot: 91,855.25
Supporting reasons: Identified as an overlap support, indicating a potential level where buying interests could pick up to stage a rebound.
1st support: 73,240.64
Supporting reasons: Identified as a pullback support that aligns close to a 161.8% Fibonacci extension, indicating a potential level where the price could stabilize once more.
1st resistance: 101,963.41
Supporting reasons: Identified as a swing-high resistance that aligns close to a 61.8 Fibonacci retracement, indicating a potential area that could halt any further upward movement.
BTC/USD (Bitcoin):
Potential Direction: Bullish
Overall momentum of the chart: Neutral
Price could fall towards the pivot and potentially make a bullish bounce off this level to rise towards the 1st resistance.
Pivot: 91,855.25
Supporting reasons: Identified as an overlap support, indicating a potential level where buying interests could pick up to stage a rebound.
1st support: 73,240.64
Supporting reasons: Identified as a pullback support that aligns close to a 161.8% Fibonacci extension, indicating a potential level where the price could stabilize once more.
1st resistance: 101,963.41
Supporting reasons: Identified as a swing-high resistance that aligns close to a 61.8 Fibonacci retracement, indicating a potential area that could halt any further upward movement.
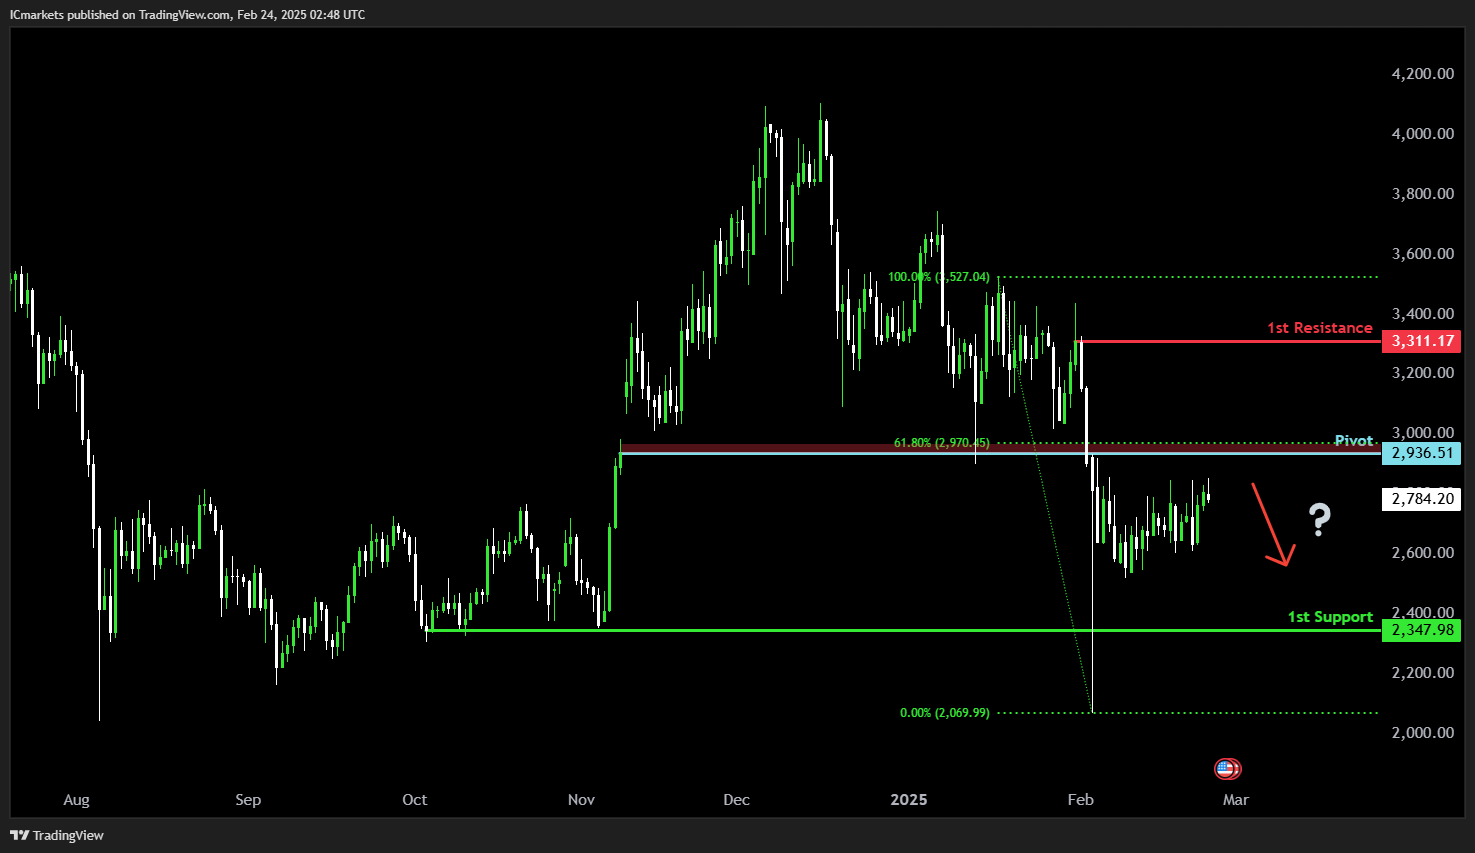
 ETH/USD (Ethereum):
Potential Direction: Bearish
Overall momentum of the chart: Neutral
Price could rise towards the pivot and potentially make a bearish reversal off this level to fall towards the 1st support.
Pivot: 2,936.51
Supporting reasons: Identified as a pullback resistance that aligns close to a 61.8% Fibonacci retracement, indicating a potential level where selling pressures could intensify.
1st support: 2,347.98
Supporting reasons: Identified as a multi-swing-low support, indicating a potential level where the price could stabilize once again.
1st resistance: 3,311.17
Supporting reasons: Identified as a swing high resistance, indicating a potential area that could halt any further upward movement.
ETH/USD (Ethereum):
Potential Direction: Bearish
Overall momentum of the chart: Neutral
Price could rise towards the pivot and potentially make a bearish reversal off this level to fall towards the 1st support.
Pivot: 2,936.51
Supporting reasons: Identified as a pullback resistance that aligns close to a 61.8% Fibonacci retracement, indicating a potential level where selling pressures could intensify.
1st support: 2,347.98
Supporting reasons: Identified as a multi-swing-low support, indicating a potential level where the price could stabilize once again.
1st resistance: 3,311.17
Supporting reasons: Identified as a swing high resistance, indicating a potential area that could halt any further upward movement.
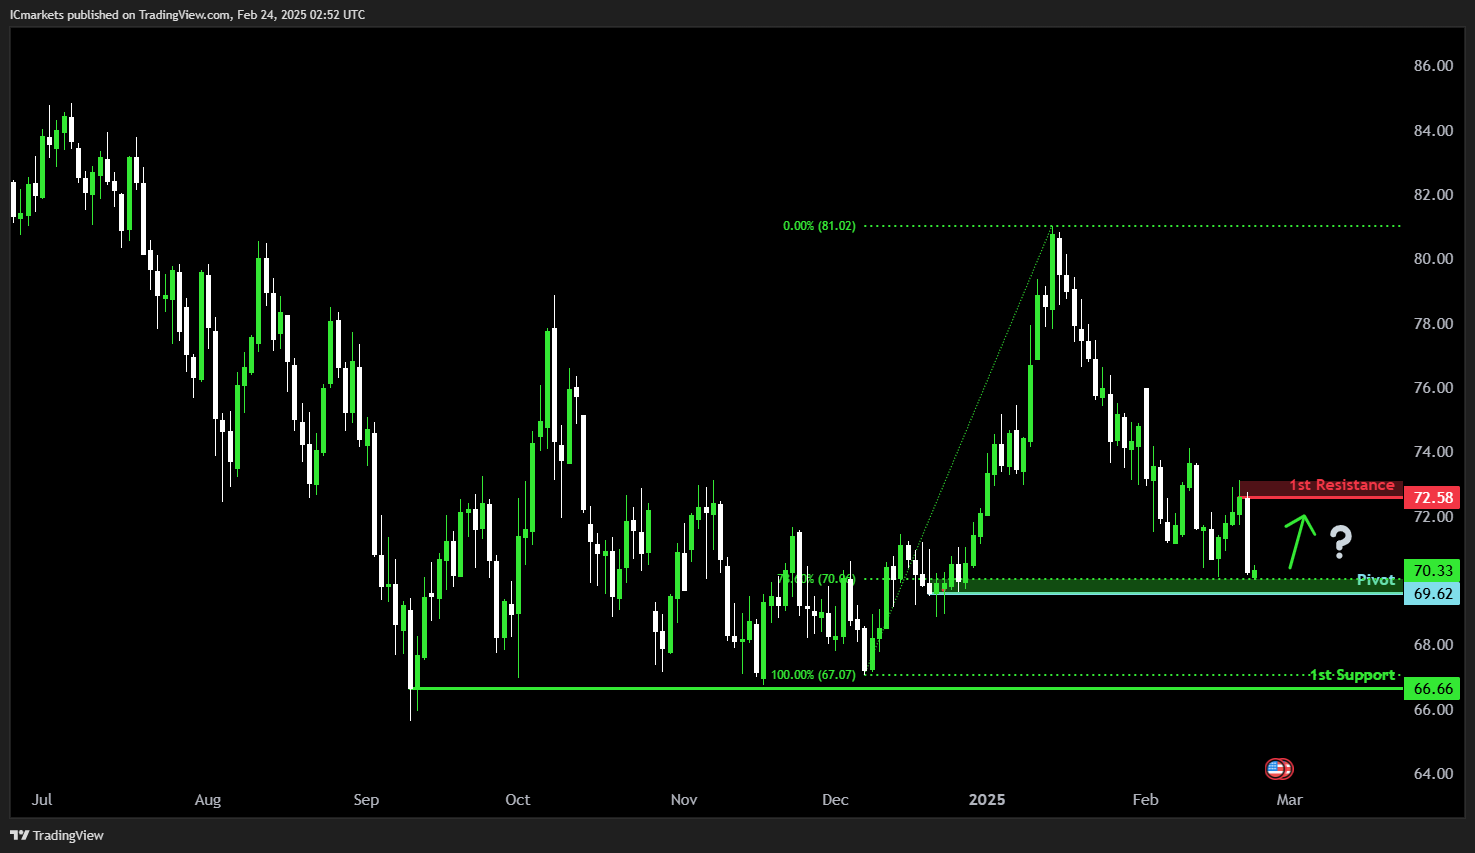
 WTI/USD (Oil):
Potential Direction: Bullish
Overall momentum of the chart: Bearish
Price could fall towards the pivot and potentially make a bullish bounce off this level to rise towards the 1st resistance.
Pivot: 69.62
Supporting reasons: Identified as a swing-low support that aligns close to a 78.6% Fibonacci retracement, indicating a potential level where buying interests could pick up to stage a rebound.
1st support: 66.66
Supporting reasons: Identified as a multi-swing-low support, indicating a key level where the price could stabilize once more.
1st resistance: 72.58
Supporting reasons: Identified as a swing-high resistance, indicating a potential area that could halt any further upward movement.
WTI/USD (Oil):
Potential Direction: Bullish
Overall momentum of the chart: Bearish
Price could fall towards the pivot and potentially make a bullish bounce off this level to rise towards the 1st resistance.
Pivot: 69.62
Supporting reasons: Identified as a swing-low support that aligns close to a 78.6% Fibonacci retracement, indicating a potential level where buying interests could pick up to stage a rebound.
1st support: 66.66
Supporting reasons: Identified as a multi-swing-low support, indicating a key level where the price could stabilize once more.
1st resistance: 72.58
Supporting reasons: Identified as a swing-high resistance, indicating a potential area that could halt any further upward movement.
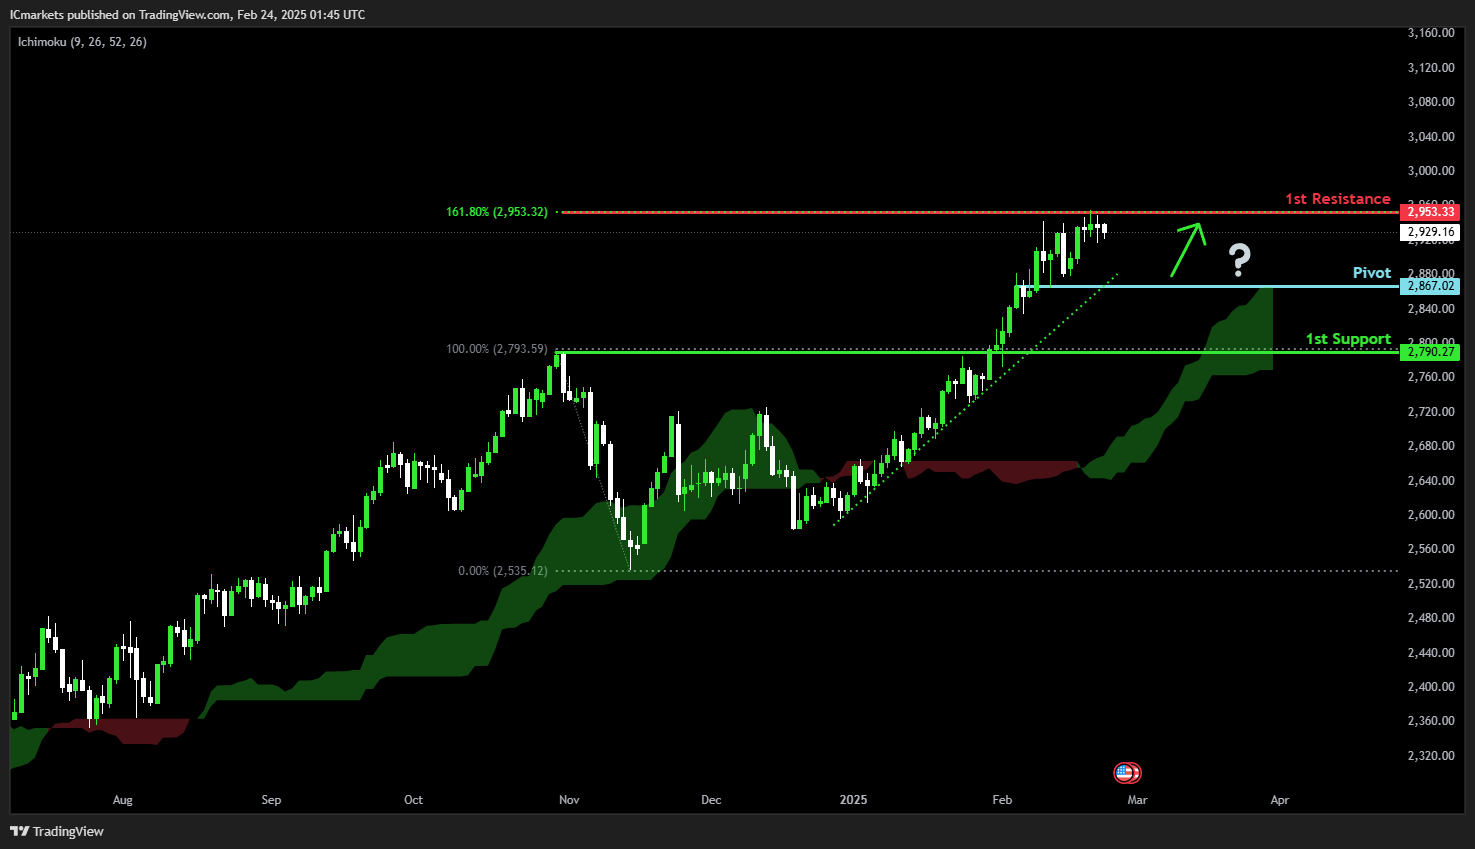
 XAU/USD (GOLD):
Potential Direction: Bullish
Overall momentum of the chart: Bullish
Price could potentially drop further to the pivot in the short term before bouncing from there and rising to the 1st resistance. Additionally, price has crossed above the Ichimoku cloud, signaling further upside potential.
Pivot: 2867.02
Supporting reasons: Identified as a pullback support, indicating a potential area where buyers could step in.
1st support: 2790.27
Supporting reasons: Identified as a pullback support, acting as a potential level where price could stabilize before continuing higher.
1st resistance: 2953.33
Supporting reasons: Identified as a multi-swing high resistance that aligns with the 161.8% Fibonacci extension, forming a strong confluence level where price could face selling pressure.
XAU/USD (GOLD):
Potential Direction: Bullish
Overall momentum of the chart: Bullish
Price could potentially drop further to the pivot in the short term before bouncing from there and rising to the 1st resistance. Additionally, price has crossed above the Ichimoku cloud, signaling further upside potential.
Pivot: 2867.02
Supporting reasons: Identified as a pullback support, indicating a potential area where buyers could step in.
1st support: 2790.27
Supporting reasons: Identified as a pullback support, acting as a potential level where price could stabilize before continuing higher.
1st resistance: 2953.33
Supporting reasons: Identified as a multi-swing high resistance that aligns with the 161.8% Fibonacci extension, forming a strong confluence level where price could face selling pressure.
 The accuracy, completeness and timeliness of the information contained on this site cannot be guaranteed. IC Markets does not warranty, guarantee or make any representations, or assume any liability regarding financial results based on the use of the information in the site.
News, views, opinions, recommendations and other information obtained from sources outside of www.icmarkets.com, used in this site are believed to be reliable, but we cannot guarantee their accuracy or completeness. All such information is subject to change at any time without notice. IC Markets assumes no responsibility for the content of any linked site.
The fact that such links may exist does not indicate approval or endorsement of any material contained on any linked site. IC Markets is not liable for any harm caused by the transmission, through accessing the services or information on this site, of a computer virus, or other computer code or programming device that might be used to access, delete, damage, disable, disrupt or otherwise impede in any manner, the operation of the site or of any user’s software, hardware, data or property.
The accuracy, completeness and timeliness of the information contained on this site cannot be guaranteed. IC Markets does not warranty, guarantee or make any representations, or assume any liability regarding financial results based on the use of the information in the site.
News, views, opinions, recommendations and other information obtained from sources outside of www.icmarkets.com, used in this site are believed to be reliable, but we cannot guarantee their accuracy or completeness. All such information is subject to change at any time without notice. IC Markets assumes no responsibility for the content of any linked site.
The fact that such links may exist does not indicate approval or endorsement of any material contained on any linked site. IC Markets is not liable for any harm caused by the transmission, through accessing the services or information on this site, of a computer virus, or other computer code or programming device that might be used to access, delete, damage, disable, disrupt or otherwise impede in any manner, the operation of the site or of any user’s software, hardware, data or property.Disclaimer:
Raw Trading Ltd is regulated by the Seychelles Financial Services Authority (FSA) with Securities Dealer’s license number SD018.
Risk Warning: Trading Forex and CFDs carries a high level of risk to your capital and you should only trade with money you can afford to lose. Trading Forex and CFDs may not be suitable for all investors, so please ensure that you fully understand the risks involved and seek independent advice if necessary. Please read and ensure you fully understand our Risk Disclosure.
Restricted Countries: Raw Trading Ltd does not provide services for residents of certain countries such as the United States of America, Canada, Israel, New Zealand, Iran and North Korea (Democratic People’s Republic of Korea) or a country where such distribution or use would be contrary to local law or regulation.
You must be 18 years old, or of legal age as determined in your country. Upon registering an account with Raw Trading Ltd, you acknowledge that you are registering at your own free will, without solicitation on behalf of Raw Trading Ltd.
Raw Trading Ltd does not direct its website and services to any individual in any country in which the use of its website and services are prohibited by local laws or regulations. When accessing this website from a country in which its use may or may not be prohibited, it is the user’s responsibility to ensure that any use of the website or services adheres to local laws or regulations. Raw Trading Ltd does not affirm that the information on its website is suitable for all jurisdictions.
Publication date:
2025-02-24 11:29:51 (GMT)