Tuesday 23rd April 2024: Technical Outlook and Review
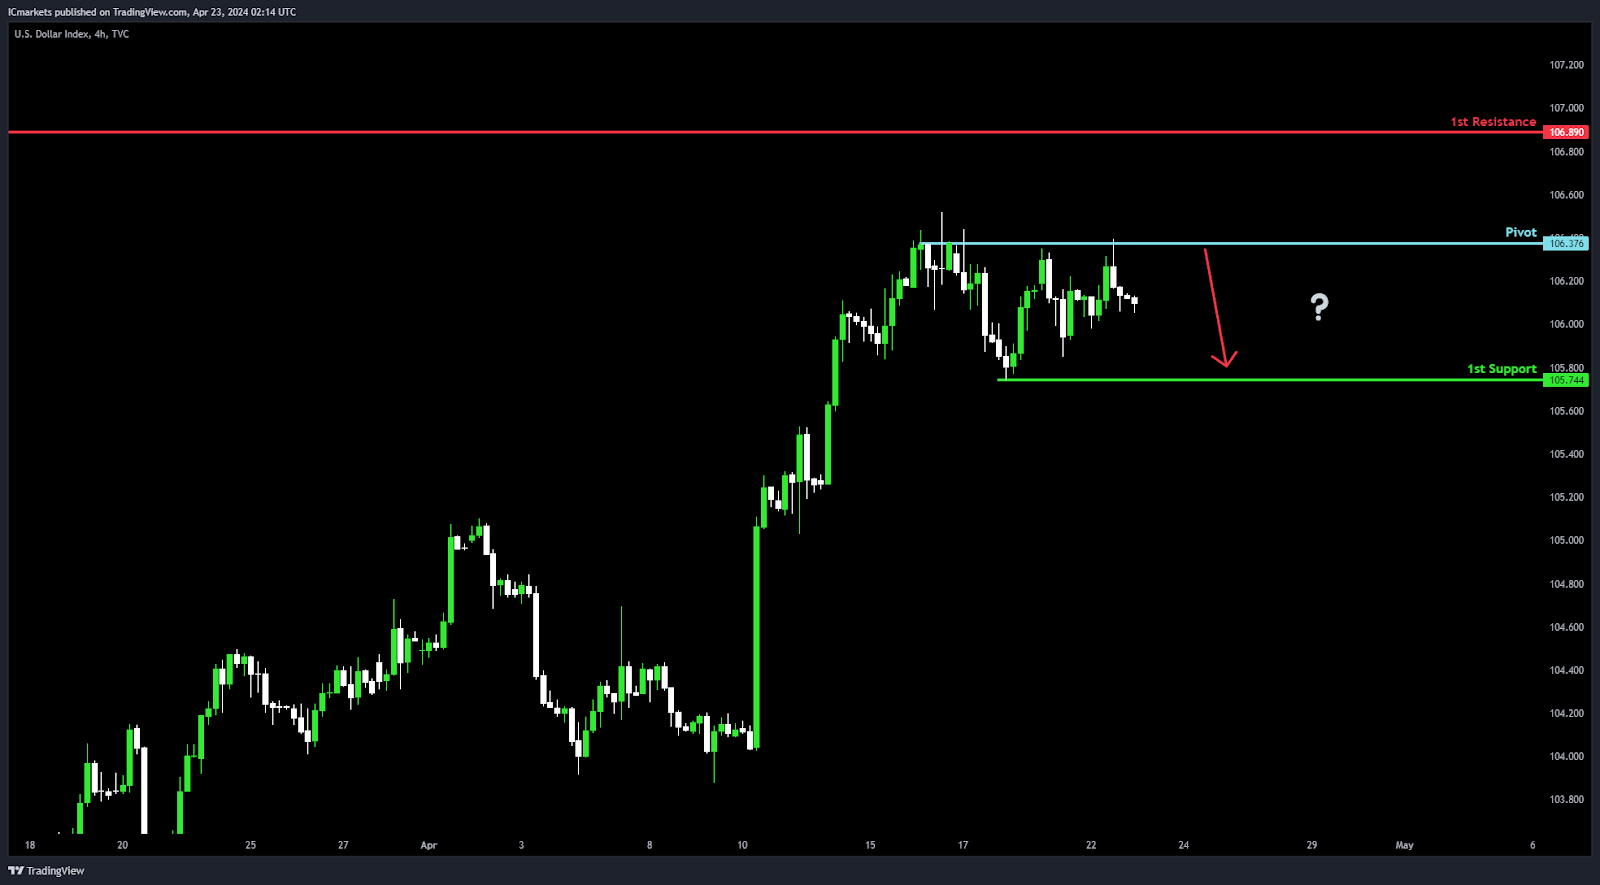
DXY (US Dollar Index):
Potential Direction: Bearish
Overall momentum of the chart: Bullish
Price could potentially make a bearish reaction off the pivot and drop to the 1st support.
PIvot: 106.37
Supporting reasons: Multi-swing high resistance, indicating a significant level where selling pressure might intensify, potentially leading to a reversal or continuation of the bullish momentum.
1st support: 105.74
Supporting reasons: Swing low support, representing a level where buyers have previously intervened to support the price, potentially acting as a foundation for a bounce or temporary halt in the bullish momentum.
1st resistance: 106.89
Supporting reasons: Swing high resistance, suggesting a level where selling pressure might increase, potentially acting as a barrier to further upside movement within the context of the overall bullish trend.
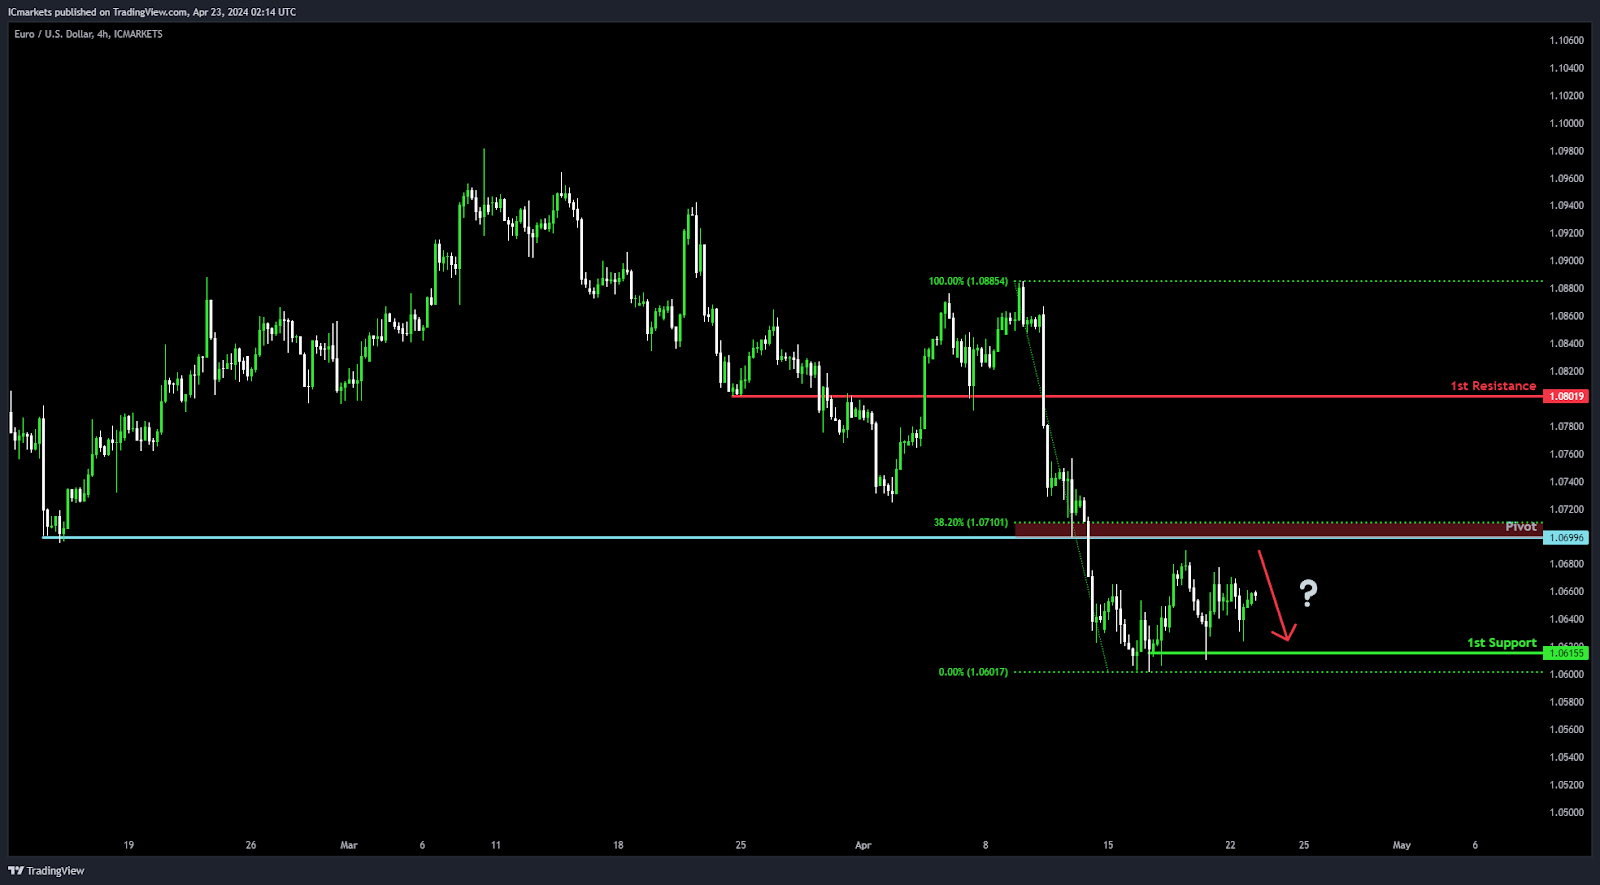
 EUR/USD:
Potential Direction: Bearish
Overall momentum of the chart: Bearish
Price could potentially make a bearish reaction off pivot and drop to the 1st support.
PIvot: 1.0699
Supporting reasons: Pullback resistance at the 38.20% Fibonacci Retracement level, indicating a significant level where selling pressure might intensify, potentially leading to a reversal or continuation of the bearish momentum.
1st support: 1.0615
Supporting reasons: Multi-swing low support, suggesting a level where buyers have previously intervened to support the price, potentially acting as a foundation for a bounce or temporary halt in the bearish momentum.
1st resistance: 1.0680
Supporting reasons: Pullback resistance, representing a level where selling pressure might increase, potentially acting as a barrier to further upward movement.
EUR/USD:
Potential Direction: Bearish
Overall momentum of the chart: Bearish
Price could potentially make a bearish reaction off pivot and drop to the 1st support.
PIvot: 1.0699
Supporting reasons: Pullback resistance at the 38.20% Fibonacci Retracement level, indicating a significant level where selling pressure might intensify, potentially leading to a reversal or continuation of the bearish momentum.
1st support: 1.0615
Supporting reasons: Multi-swing low support, suggesting a level where buyers have previously intervened to support the price, potentially acting as a foundation for a bounce or temporary halt in the bearish momentum.
1st resistance: 1.0680
Supporting reasons: Pullback resistance, representing a level where selling pressure might increase, potentially acting as a barrier to further upward movement.
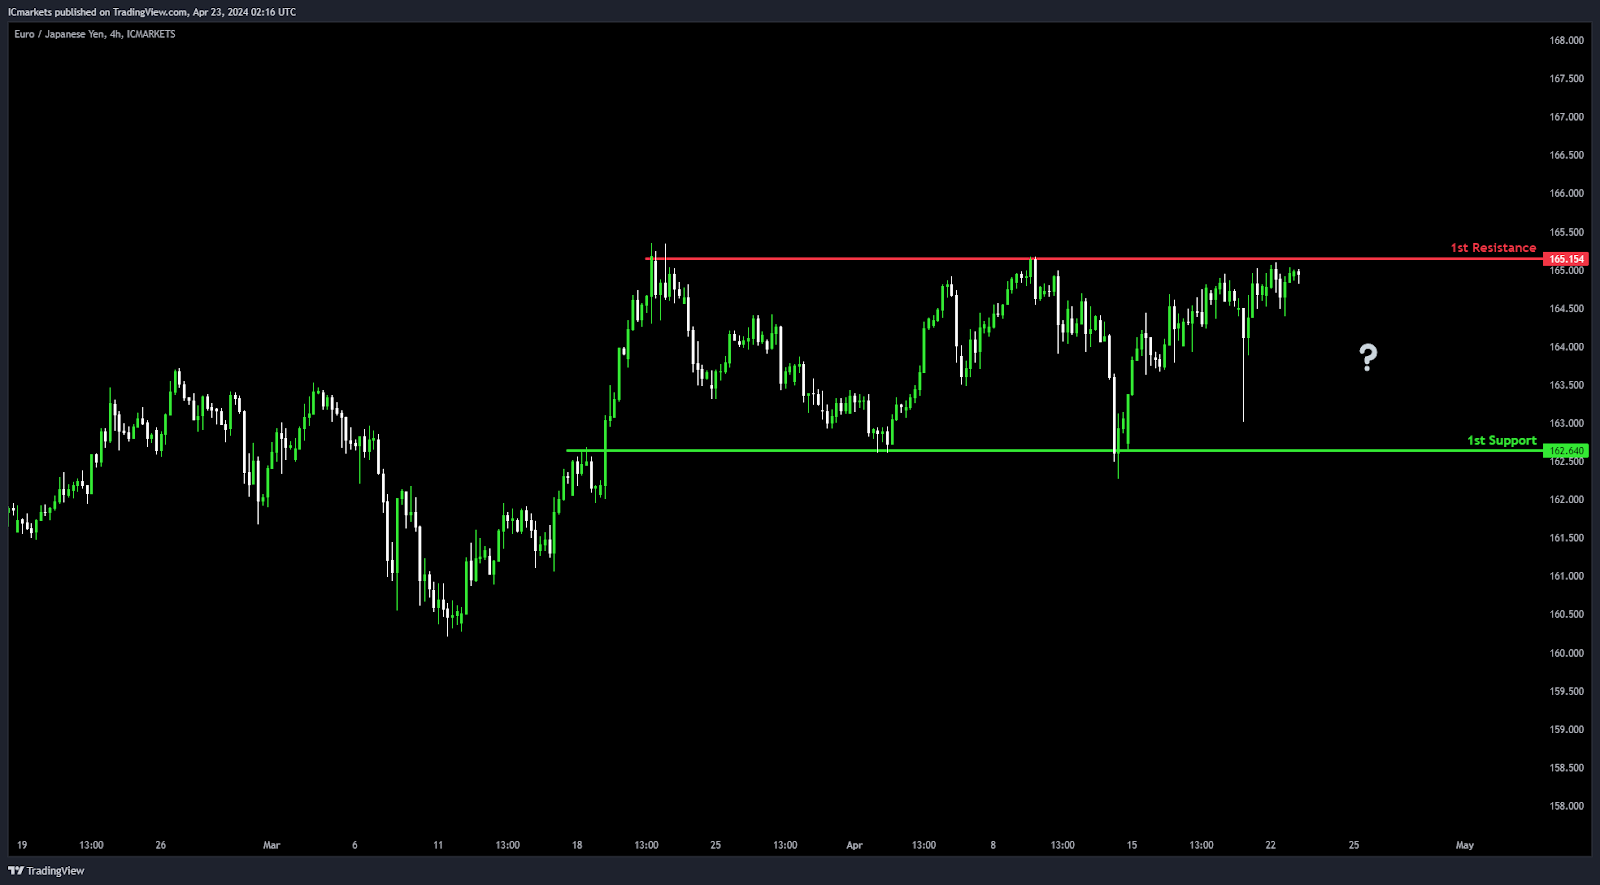
 EUR/JPY:
Potential Direction: Neutral
Overall momentum of the chart: Neutral
Price could potentially make a fluctuation between the 1st resistance and 1st support level.
1st support: 162.64
Supporting reasons: Multi-swing low support, indicating a level where buyers have previously intervened to support the price, potentially acting as a foundation for a bounce or temporary halt in the momentum.
1st resistance: 154.15
Supporting reasons: Multi-swing high resistance, representing a level where selling pressure might increase, potentially acting as a barrier to further upward movement.
EUR/JPY:
Potential Direction: Neutral
Overall momentum of the chart: Neutral
Price could potentially make a fluctuation between the 1st resistance and 1st support level.
1st support: 162.64
Supporting reasons: Multi-swing low support, indicating a level where buyers have previously intervened to support the price, potentially acting as a foundation for a bounce or temporary halt in the momentum.
1st resistance: 154.15
Supporting reasons: Multi-swing high resistance, representing a level where selling pressure might increase, potentially acting as a barrier to further upward movement.
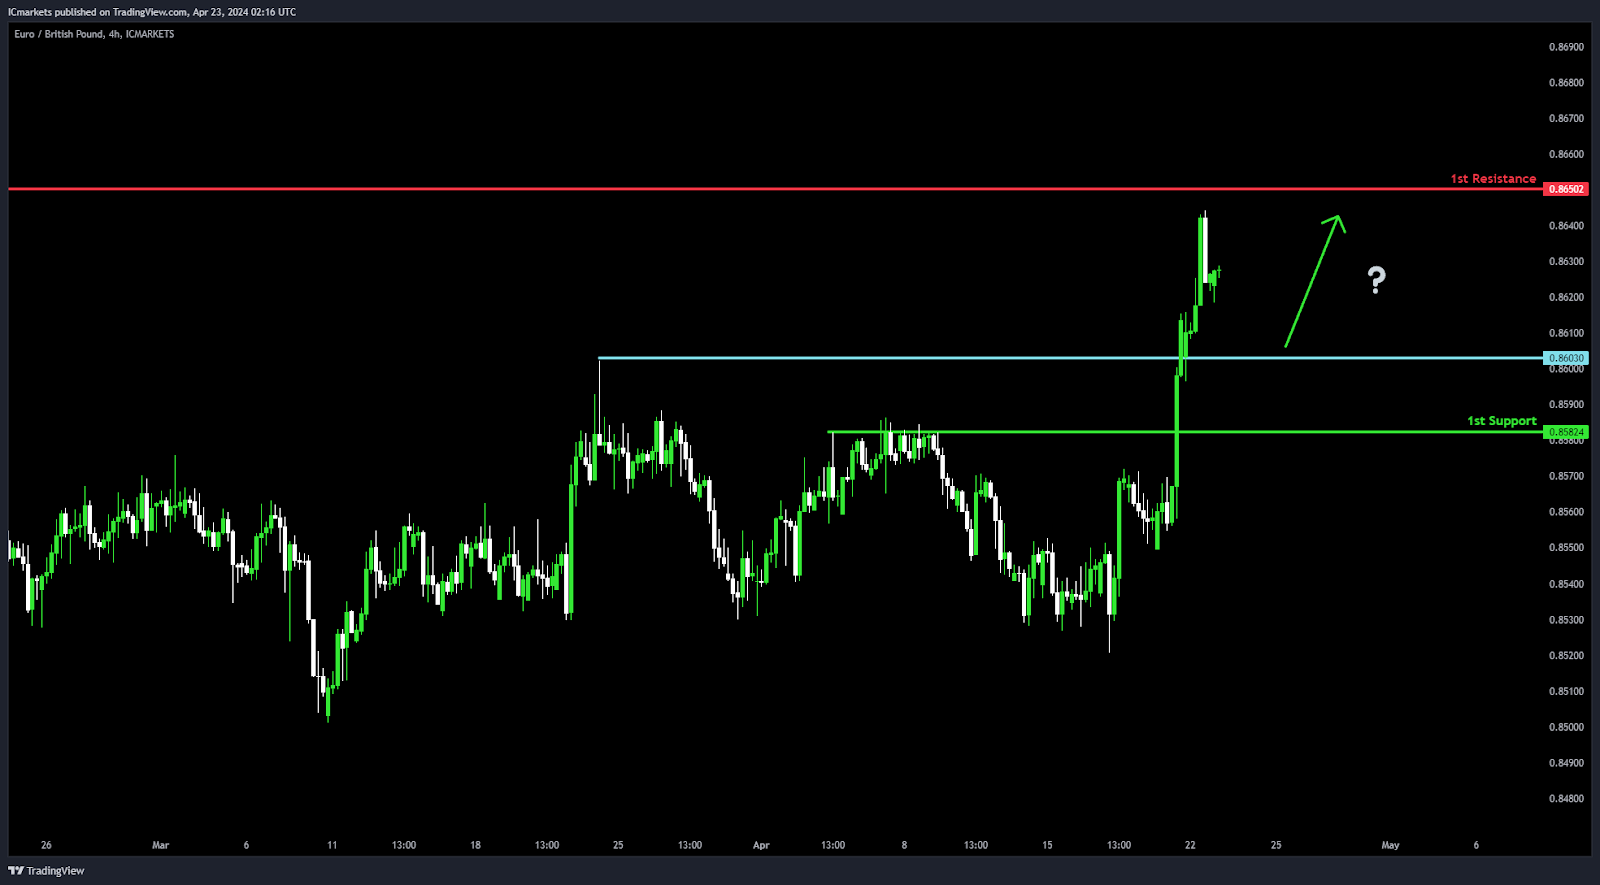
 EUR/GBP:
Potential Direction: Bullish
Overall momentum of the chart: Bullish
Price could potentially make a bullish bounce off the pivot and head towards the 1st resistance.
PIvot: 0.8603
Supporting reasons: Pullback support, indicating a level where buyers might step in to support the price, potentially providing a foundation for a bounce.
1st support: 0.8582
Supporting reasons: Pullback support, suggesting a level where buyers have previously intervened to support the price.
1st resistance: 0.8650
Supporting reasons: Pullback resistance, representing a level where selling pressure might intensify, potentially acting as a barrier to further upward movement.
EUR/GBP:
Potential Direction: Bullish
Overall momentum of the chart: Bullish
Price could potentially make a bullish bounce off the pivot and head towards the 1st resistance.
PIvot: 0.8603
Supporting reasons: Pullback support, indicating a level where buyers might step in to support the price, potentially providing a foundation for a bounce.
1st support: 0.8582
Supporting reasons: Pullback support, suggesting a level where buyers have previously intervened to support the price.
1st resistance: 0.8650
Supporting reasons: Pullback resistance, representing a level where selling pressure might intensify, potentially acting as a barrier to further upward movement.
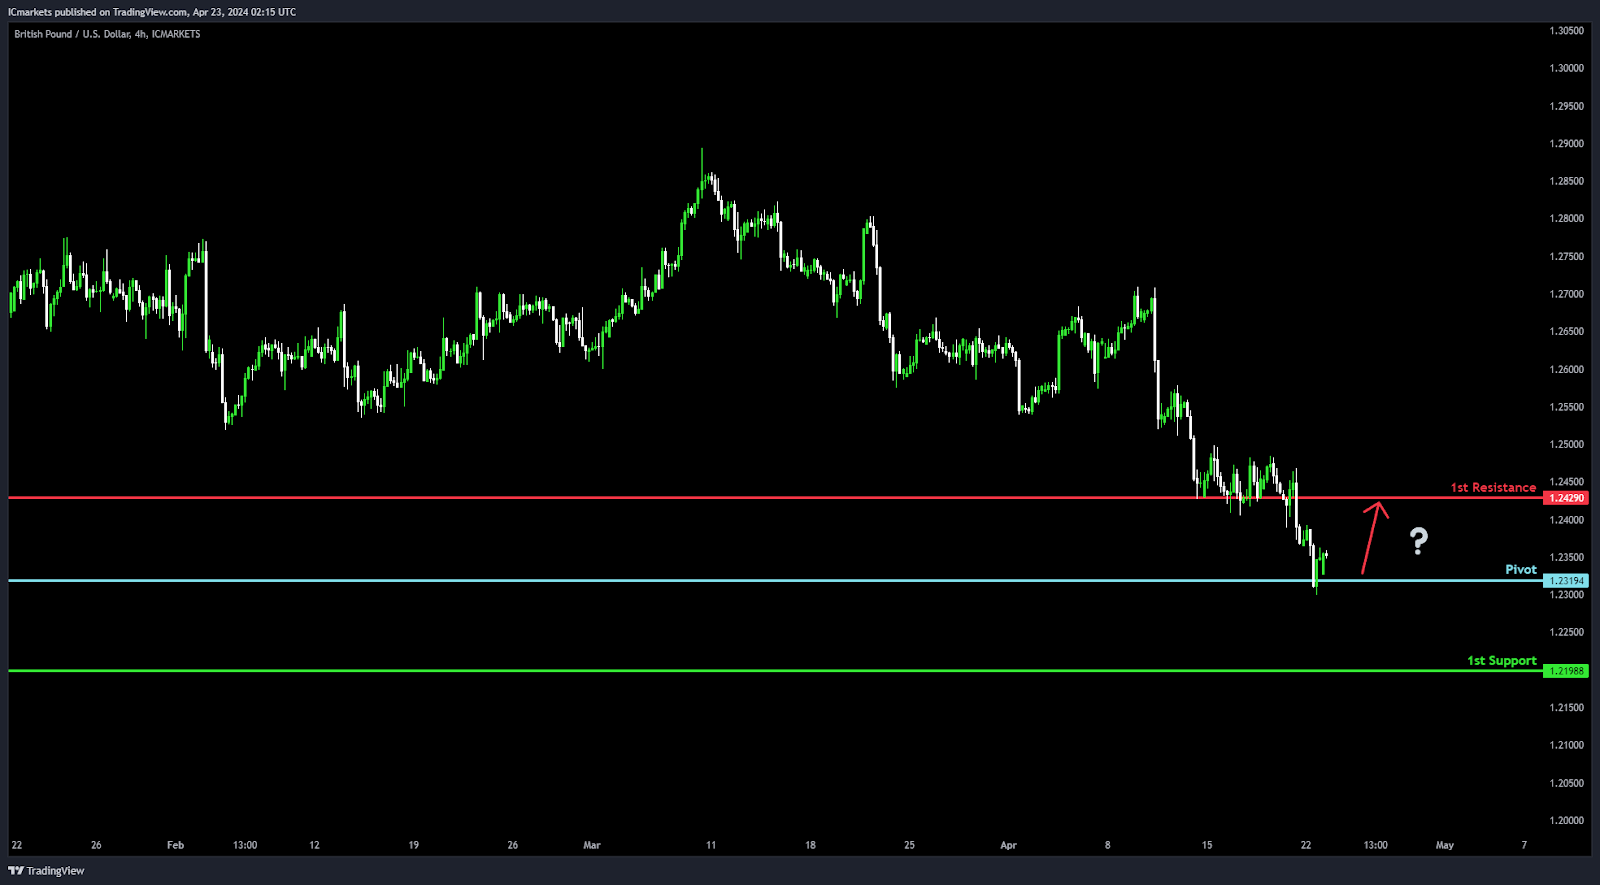
 GBP/USD:
Potential Direction: Bullish
Overall momentum of the chart: Bearish
Price could potentially make a bullish bounce off the pivot and head towards the 1st resistance.
PIvot: 1.2319
Supporting reasons: An Overlap support, indicating a significant level where buyers might step in to support the price.
1st support: 1.2198
Supporting reasons: An Overlap support, suggesting a level where buyers have previously intervened to support the price.
1st resistance: 1.2429
Supporting reasons: Pullback resistance, representing a level where selling pressure might intensify, potentially acting as a barrier to further upward movement.
GBP/USD:
Potential Direction: Bullish
Overall momentum of the chart: Bearish
Price could potentially make a bullish bounce off the pivot and head towards the 1st resistance.
PIvot: 1.2319
Supporting reasons: An Overlap support, indicating a significant level where buyers might step in to support the price.
1st support: 1.2198
Supporting reasons: An Overlap support, suggesting a level where buyers have previously intervened to support the price.
1st resistance: 1.2429
Supporting reasons: Pullback resistance, representing a level where selling pressure might intensify, potentially acting as a barrier to further upward movement.
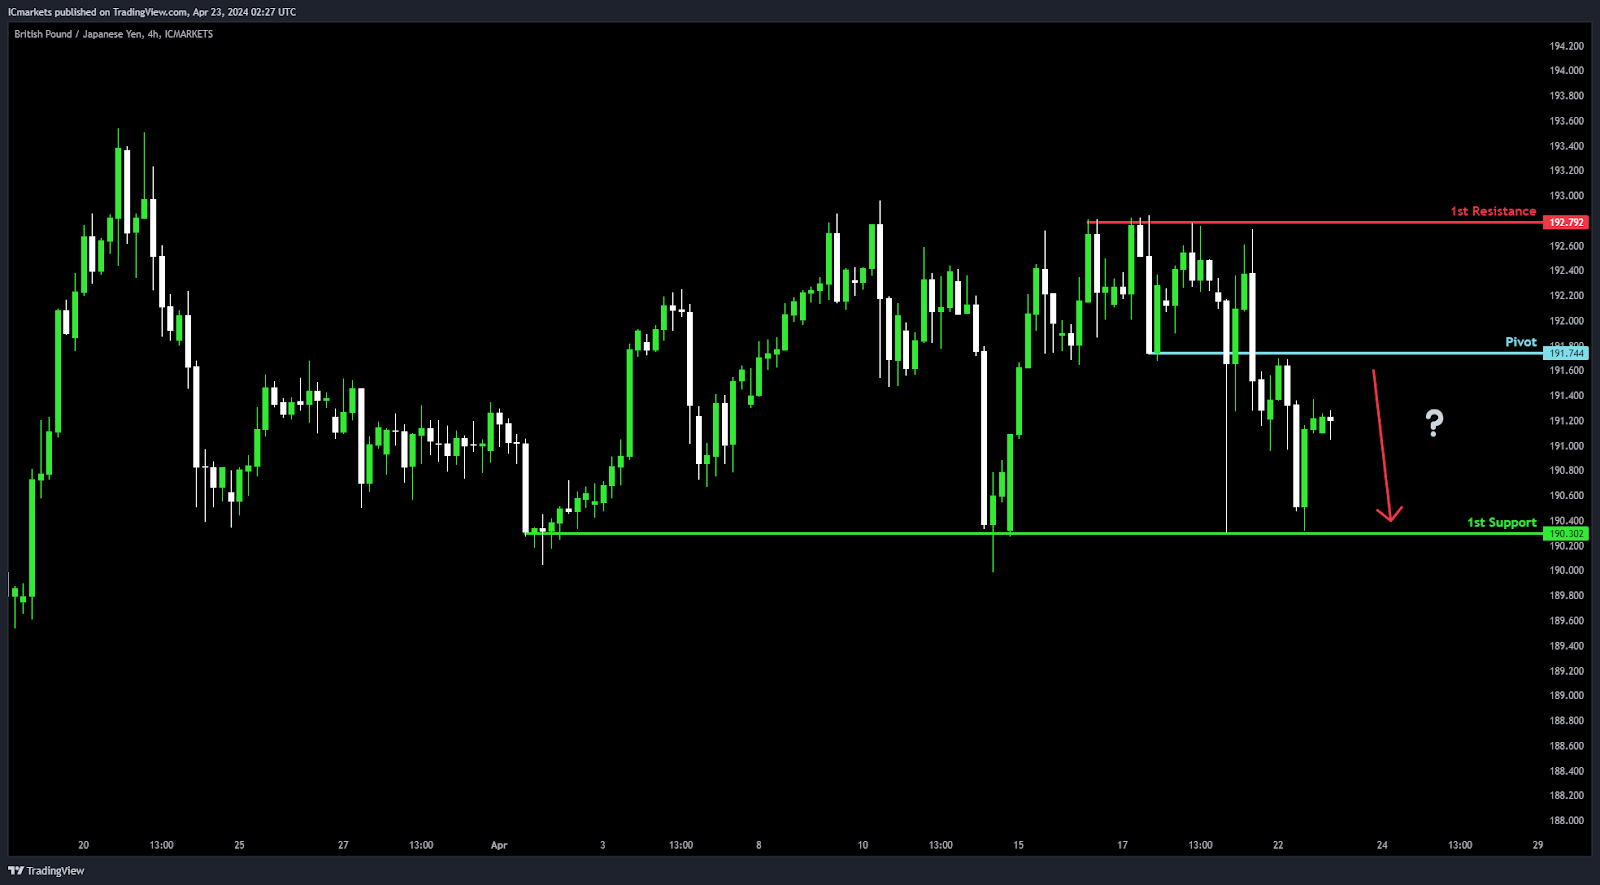
 GBP/JPY:
Potential Direction: Bearish
Overall momentum of the chart: Bearish
Price could potentially make a bearish continuation towards the 1st support.
PIvot: 191.74
Supporting reasons: An Overlap resistance, indicating a significant level where selling pressure might increase.
1st support: 190.30
Supporting reasons: Multi-swing low support, suggesting a level where buyers have previously intervened to support the price.
1st resistance: 192.79
Supporting reasons: Multi-swing high resistance, representing a level where selling pressure might intensify, potentially acting as a barrier to further upward movement.
GBP/JPY:
Potential Direction: Bearish
Overall momentum of the chart: Bearish
Price could potentially make a bearish continuation towards the 1st support.
PIvot: 191.74
Supporting reasons: An Overlap resistance, indicating a significant level where selling pressure might increase.
1st support: 190.30
Supporting reasons: Multi-swing low support, suggesting a level where buyers have previously intervened to support the price.
1st resistance: 192.79
Supporting reasons: Multi-swing high resistance, representing a level where selling pressure might intensify, potentially acting as a barrier to further upward movement.
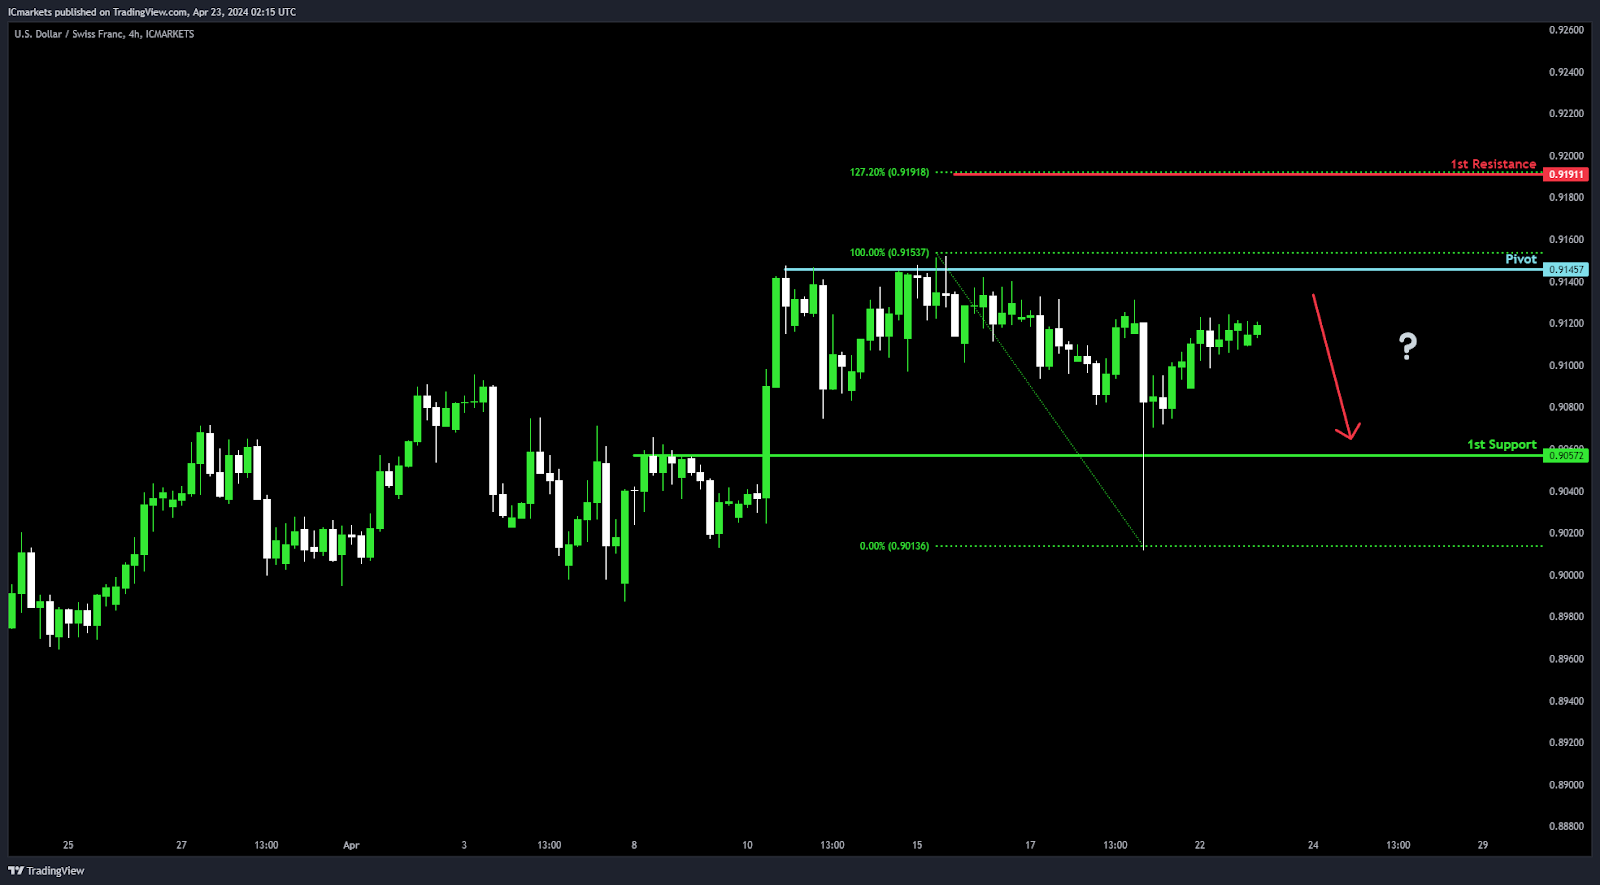
 USD/CHF:
Potential Direction: Bearish
Overall momentum of the chart: Bearish
Price could potentially make a bearish reaction off pivot and drop to 1st support.
PIvot: 0.9145
Supporting reasons: Multi-swing high resistance, indicating a level where selling pressure might intensify, potentially leading to a reversal or continuation of the bearish momentum.
1st support: 0.9057
Supporting reasons: An Overlap support, suggesting a level where buyers might step in to support the price, potentially providing a foundation for a bounce or temporary halt in the bearish momentum.
1st resistance: 0.9191
Supporting reasons: 127.20% Fibonacci Extension, representing a level where selling pressure might increase, potentially acting as a barrier to further downside movement.
USD/CHF:
Potential Direction: Bearish
Overall momentum of the chart: Bearish
Price could potentially make a bearish reaction off pivot and drop to 1st support.
PIvot: 0.9145
Supporting reasons: Multi-swing high resistance, indicating a level where selling pressure might intensify, potentially leading to a reversal or continuation of the bearish momentum.
1st support: 0.9057
Supporting reasons: An Overlap support, suggesting a level where buyers might step in to support the price, potentially providing a foundation for a bounce or temporary halt in the bearish momentum.
1st resistance: 0.9191
Supporting reasons: 127.20% Fibonacci Extension, representing a level where selling pressure might increase, potentially acting as a barrier to further downside movement.
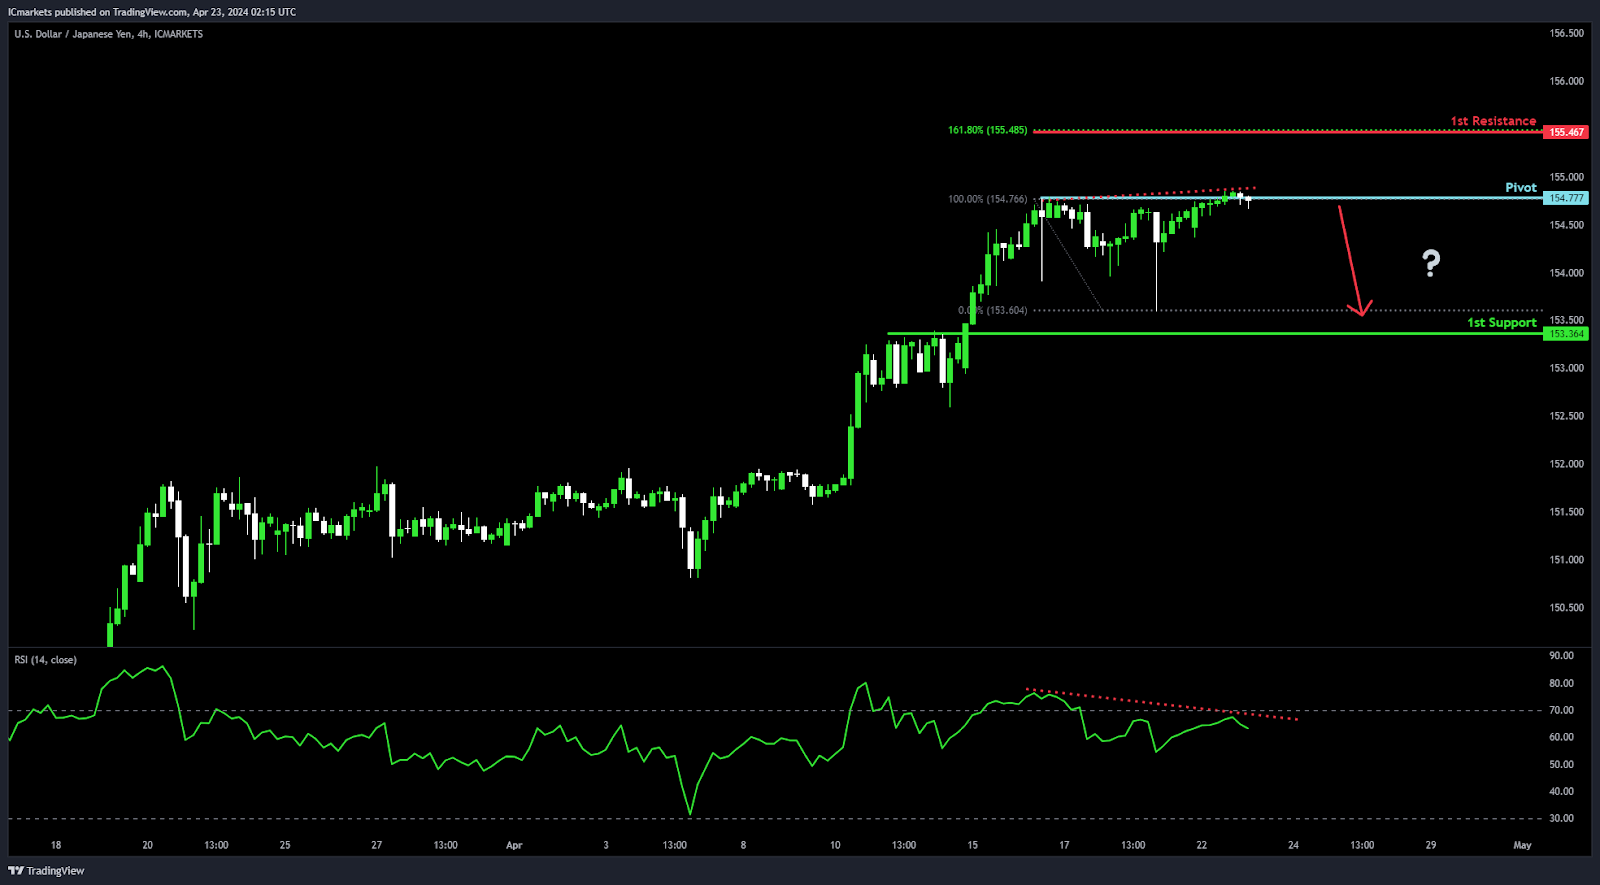
 USD/JPY:
Potential Direction: Bearish
Overall momentum of the chart: Bullish
Price could potentially make a bearish reaction off pivot and drop to 1st support.
PIvot: 154.77
Supporting reasons: Multi-swing high resistance, indicating a level where selling pressure might intensify, potentially leading to a reversal or continuation of the bullish momentum.
1st support: 153.36
Supporting reasons: Pullback support, suggesting a level where buyers might step in to support the price, potentially providing a foundation for a bounce or temporary halt in the bullish momentum.
1st resistance: 155.46
Supporting reasons: 161.80% Fibonacci Extension, representing a level where selling pressure might increase, potentially acting as a barrier to further upside movement. Additionally, RSI is also displaying bearish divergence versus price, suggesting that a reversal might occur soon.
USD/JPY:
Potential Direction: Bearish
Overall momentum of the chart: Bullish
Price could potentially make a bearish reaction off pivot and drop to 1st support.
PIvot: 154.77
Supporting reasons: Multi-swing high resistance, indicating a level where selling pressure might intensify, potentially leading to a reversal or continuation of the bullish momentum.
1st support: 153.36
Supporting reasons: Pullback support, suggesting a level where buyers might step in to support the price, potentially providing a foundation for a bounce or temporary halt in the bullish momentum.
1st resistance: 155.46
Supporting reasons: 161.80% Fibonacci Extension, representing a level where selling pressure might increase, potentially acting as a barrier to further upside movement. Additionally, RSI is also displaying bearish divergence versus price, suggesting that a reversal might occur soon.
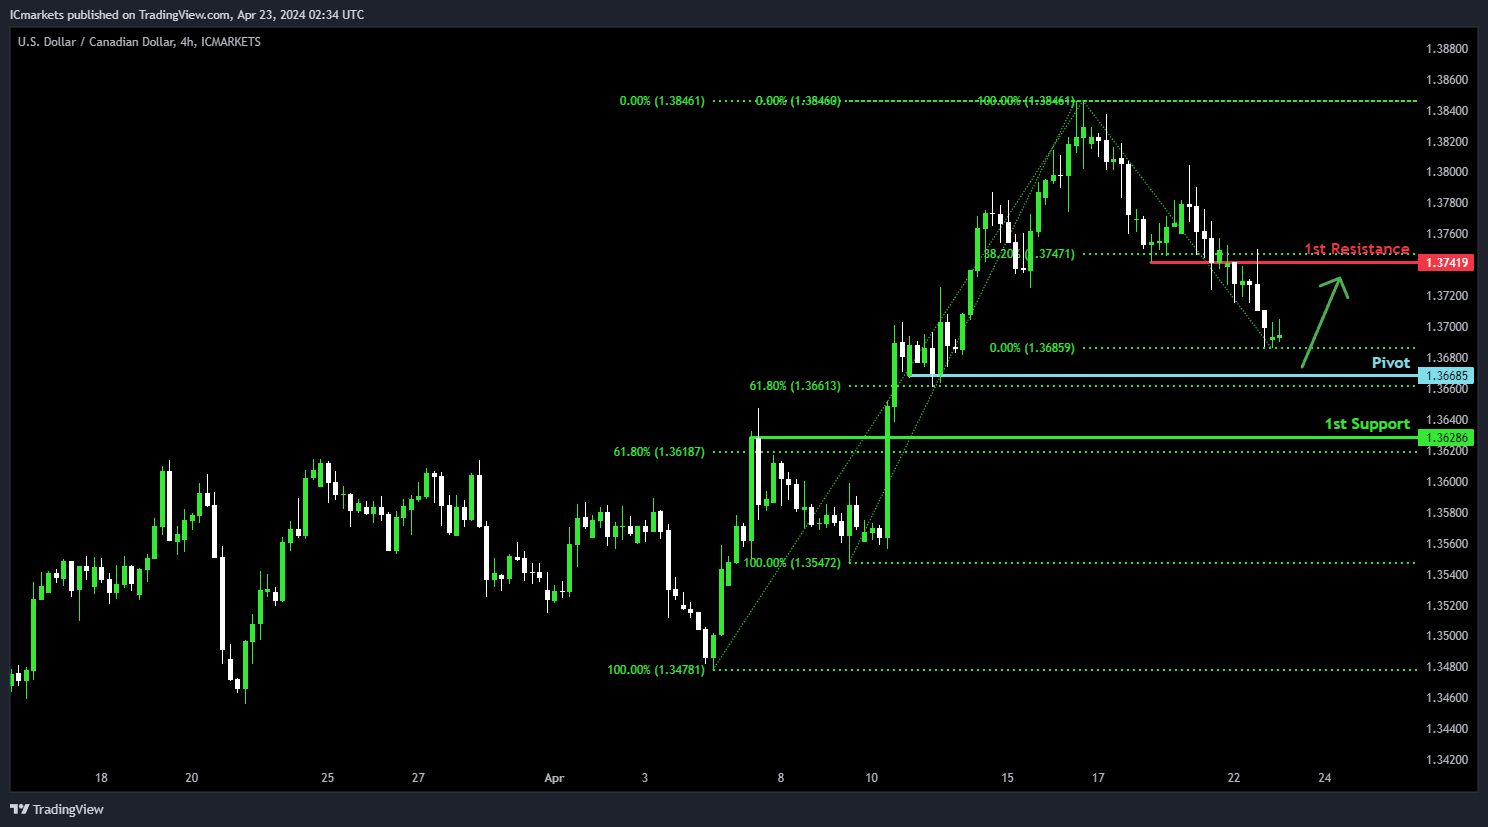
 USD/CAD:
Potential Direction: Bullish
Overall momentum of the chart: Bearish
Price could fall towards the pivot and potentially make a bullish bounce off this level to rise towards the 1st resistance
Pivot: 1.3668
Supporting reasons: Acts as a pullback support that aligns with a 61.8% Fibonacci retracement level, suggesting a significant area where price could find a solid foundation for potential price stabilization or a rebound.
1st support: 1.3628
Supporting reasons: Identified as a pullback support that aligns close to a 61.8% Fibonacci retracement level, suggesting an area where price has previously found strong buying interest to potentially halt any further downward movement.
1st resistance: 1.3741
Supporting reasons: Identified as an overlap resistance that aligns with a 38.2% Fibonacci retracement level, marking a significant barrier that could cap further upward movements.
USD/CAD:
Potential Direction: Bullish
Overall momentum of the chart: Bearish
Price could fall towards the pivot and potentially make a bullish bounce off this level to rise towards the 1st resistance
Pivot: 1.3668
Supporting reasons: Acts as a pullback support that aligns with a 61.8% Fibonacci retracement level, suggesting a significant area where price could find a solid foundation for potential price stabilization or a rebound.
1st support: 1.3628
Supporting reasons: Identified as a pullback support that aligns close to a 61.8% Fibonacci retracement level, suggesting an area where price has previously found strong buying interest to potentially halt any further downward movement.
1st resistance: 1.3741
Supporting reasons: Identified as an overlap resistance that aligns with a 38.2% Fibonacci retracement level, marking a significant barrier that could cap further upward movements.
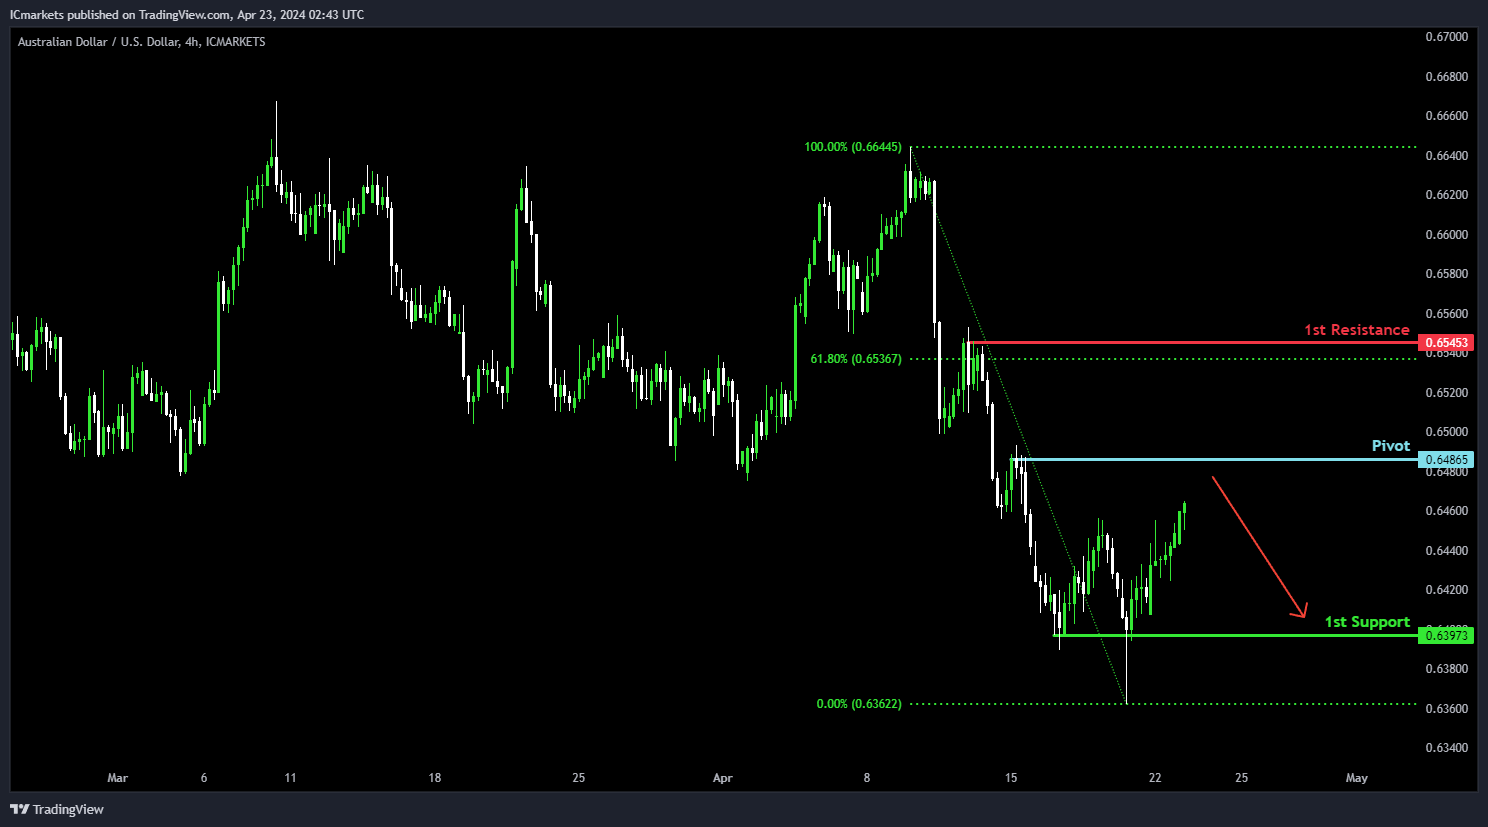
 AUD/USD:
Potential Direction: Bearish
Overall momentum of the chart: Neutral
Price could rise towards the pivot and potentially make a bearish reaction off this level to drop towards the 1st support
Pivot: 0.6486
Supporting reasons: Acts as a pullback resistance, suggesting a significant area where price has previously faced strong selling pressures and could stall around this level before reversing to drop lower.
1st support: 0.6397
Supporting reasons: Acts as a pullback support, suggesting a significant area where price has previously found strong support and could provide a basis to halt further downward movement.
1st resistance: 0.6545
Supporting reasons: Identified as a pullback resistance that aligns close to a 61.8% Fibonacci retracement level, marking a barrier that has previously capped upward movements.
AUD/USD:
Potential Direction: Bearish
Overall momentum of the chart: Neutral
Price could rise towards the pivot and potentially make a bearish reaction off this level to drop towards the 1st support
Pivot: 0.6486
Supporting reasons: Acts as a pullback resistance, suggesting a significant area where price has previously faced strong selling pressures and could stall around this level before reversing to drop lower.
1st support: 0.6397
Supporting reasons: Acts as a pullback support, suggesting a significant area where price has previously found strong support and could provide a basis to halt further downward movement.
1st resistance: 0.6545
Supporting reasons: Identified as a pullback resistance that aligns close to a 61.8% Fibonacci retracement level, marking a barrier that has previously capped upward movements.
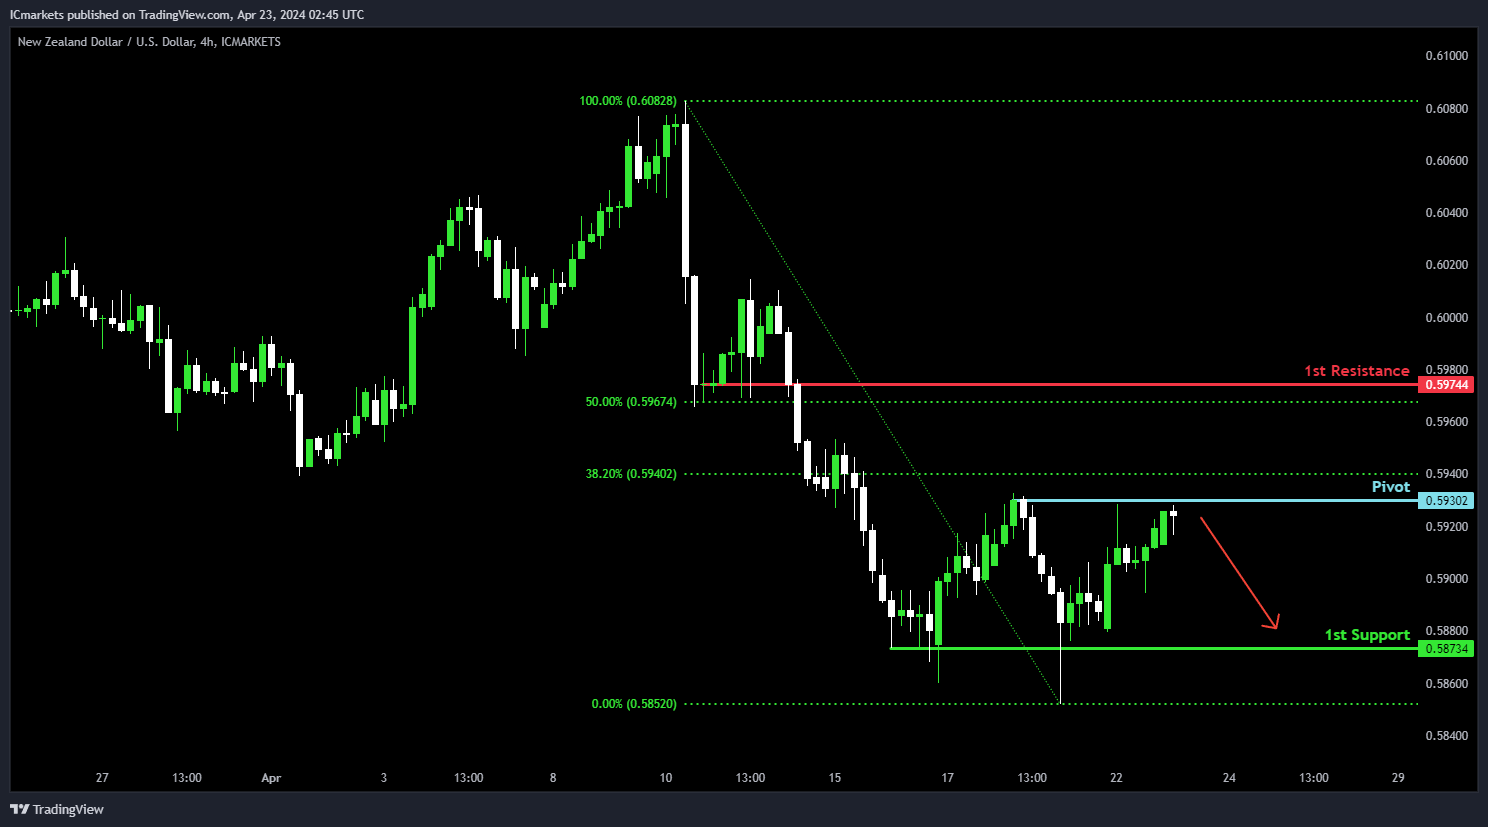
 NZD/USD:
Potential Direction: Bearish
Overall momentum of the chart: Neutral
Price could rise towards the pivot and potentially make a bearish reaction off this level to drop towards the 1st support
Pivot: 0.5930
Supporting reasons: Acts as a pullback resistance that aligns close to a 38.2% Fibonacci retracement level, suggesting a significant area where price has previously faced strong selling pressures and could stall around this level before reversing to drop lower.
1st support: 0.5873
Supporting reasons: Acts as a pullback support, suggesting a potential area for price stabilization or a minor rebound within the bearish context.
1st resistance: 0.5974
Supporting reasons: Identified as a pullback resistance that aligns close to a 50% Fibonacci retracement level, marking a barrier that has previously capped upward movements.
NZD/USD:
Potential Direction: Bearish
Overall momentum of the chart: Neutral
Price could rise towards the pivot and potentially make a bearish reaction off this level to drop towards the 1st support
Pivot: 0.5930
Supporting reasons: Acts as a pullback resistance that aligns close to a 38.2% Fibonacci retracement level, suggesting a significant area where price has previously faced strong selling pressures and could stall around this level before reversing to drop lower.
1st support: 0.5873
Supporting reasons: Acts as a pullback support, suggesting a potential area for price stabilization or a minor rebound within the bearish context.
1st resistance: 0.5974
Supporting reasons: Identified as a pullback resistance that aligns close to a 50% Fibonacci retracement level, marking a barrier that has previously capped upward movements.
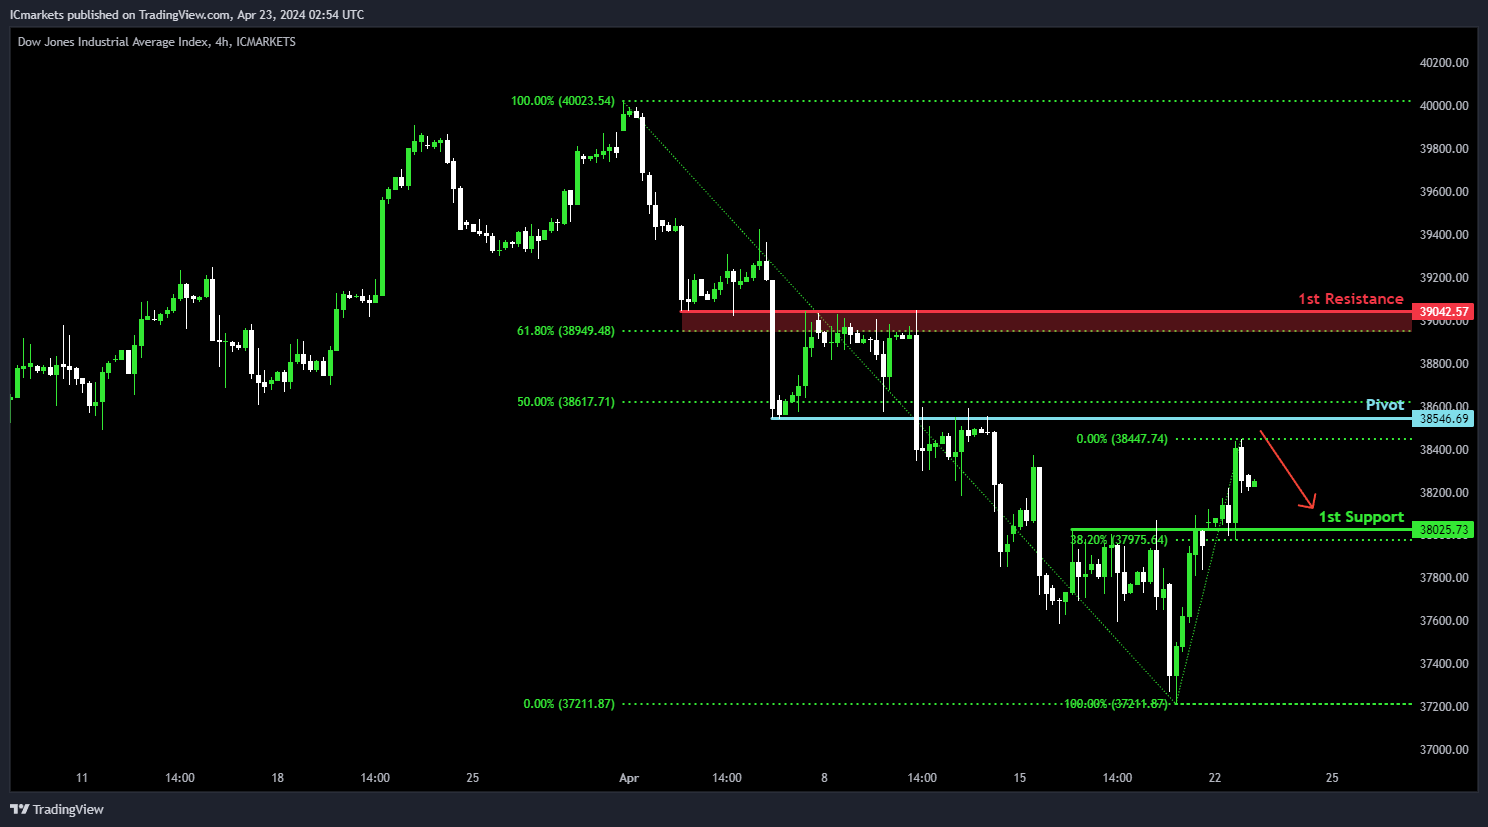
 US30 (DJIA):
Potential Direction: Bearish
Overall momentum of the chart: Neutral
Price could rise towards the pivot and potentially make a bearish reaction off this level to drop towards the 1st support
Pivot: 38,546.69
Supporting reasons: Acts as an overlap resistance that aligns with a 50% Fibonacci retracement level, suggesting a significant area where price has previously faced strong selling pressures and could stall around this level before reversing to drop lower.
1st support: 38,025.73
Supporting reasons: Identified as an overlap support that aligns with a 38.2% Fibonacci retracement level, suggesting a significant area where price has previously found strong buying interest and could provide a solid foundation to halt further downward movement.
1st resistance: 39,042.57
Supporting reasons: Identified as an overlap resistance that aligns with a 61.8% Fibonacci retracement level, indicating a potential barrier that could cap any upward movements.
US30 (DJIA):
Potential Direction: Bearish
Overall momentum of the chart: Neutral
Price could rise towards the pivot and potentially make a bearish reaction off this level to drop towards the 1st support
Pivot: 38,546.69
Supporting reasons: Acts as an overlap resistance that aligns with a 50% Fibonacci retracement level, suggesting a significant area where price has previously faced strong selling pressures and could stall around this level before reversing to drop lower.
1st support: 38,025.73
Supporting reasons: Identified as an overlap support that aligns with a 38.2% Fibonacci retracement level, suggesting a significant area where price has previously found strong buying interest and could provide a solid foundation to halt further downward movement.
1st resistance: 39,042.57
Supporting reasons: Identified as an overlap resistance that aligns with a 61.8% Fibonacci retracement level, indicating a potential barrier that could cap any upward movements.
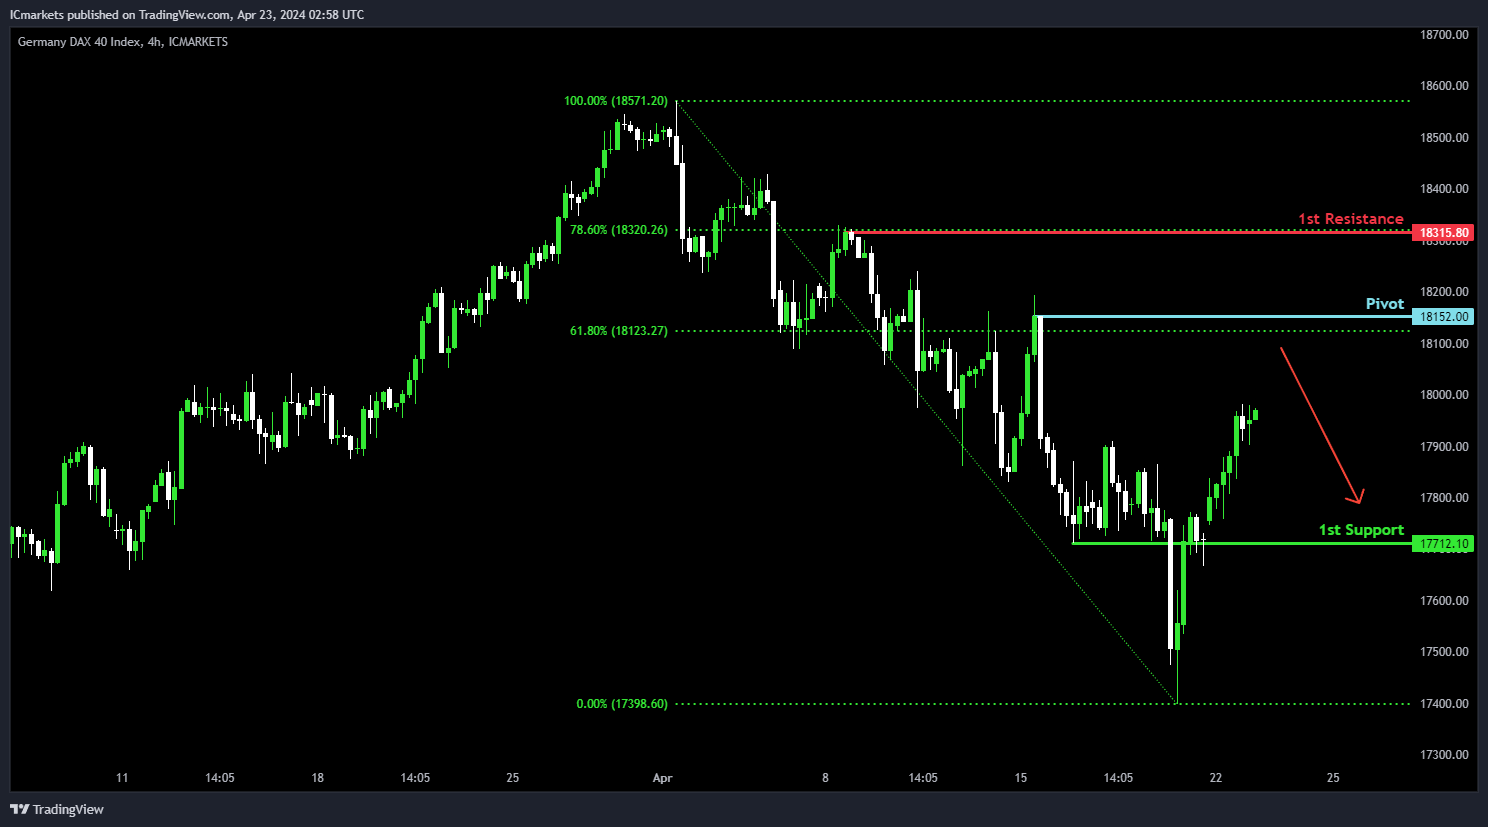
 DE40 (DAX):
Potential Direction: Bearish
Overall momentum of the chart: Neutral
Price could rise towards the pivot and potentially make a bearish reaction off this level to drop towards the 1st support
Pivot: 18,152.00
Supporting reasons: Acts as a pullback support that aligns with a 61.8% Fibonacci retracement level, suggesting a significant area where price has previously faced strong selling pressures and could stall around this level before reversing to drop lower.
1st support: 17,712.10
Supporting reasons: Acts as a pullback support, suggesting a significant area where price has previously found strong buying interest and could provide a solid foundation to halt further downward movement.
1st resistance: 18,315.80
Supporting reasons: Identified as a pullback resistance that aligns with a 78.6% Fibonacci retracement level, potentially functioning as a barrier that could cap any upward movements.
DE40 (DAX):
Potential Direction: Bearish
Overall momentum of the chart: Neutral
Price could rise towards the pivot and potentially make a bearish reaction off this level to drop towards the 1st support
Pivot: 18,152.00
Supporting reasons: Acts as a pullback support that aligns with a 61.8% Fibonacci retracement level, suggesting a significant area where price has previously faced strong selling pressures and could stall around this level before reversing to drop lower.
1st support: 17,712.10
Supporting reasons: Acts as a pullback support, suggesting a significant area where price has previously found strong buying interest and could provide a solid foundation to halt further downward movement.
1st resistance: 18,315.80
Supporting reasons: Identified as a pullback resistance that aligns with a 78.6% Fibonacci retracement level, potentially functioning as a barrier that could cap any upward movements.
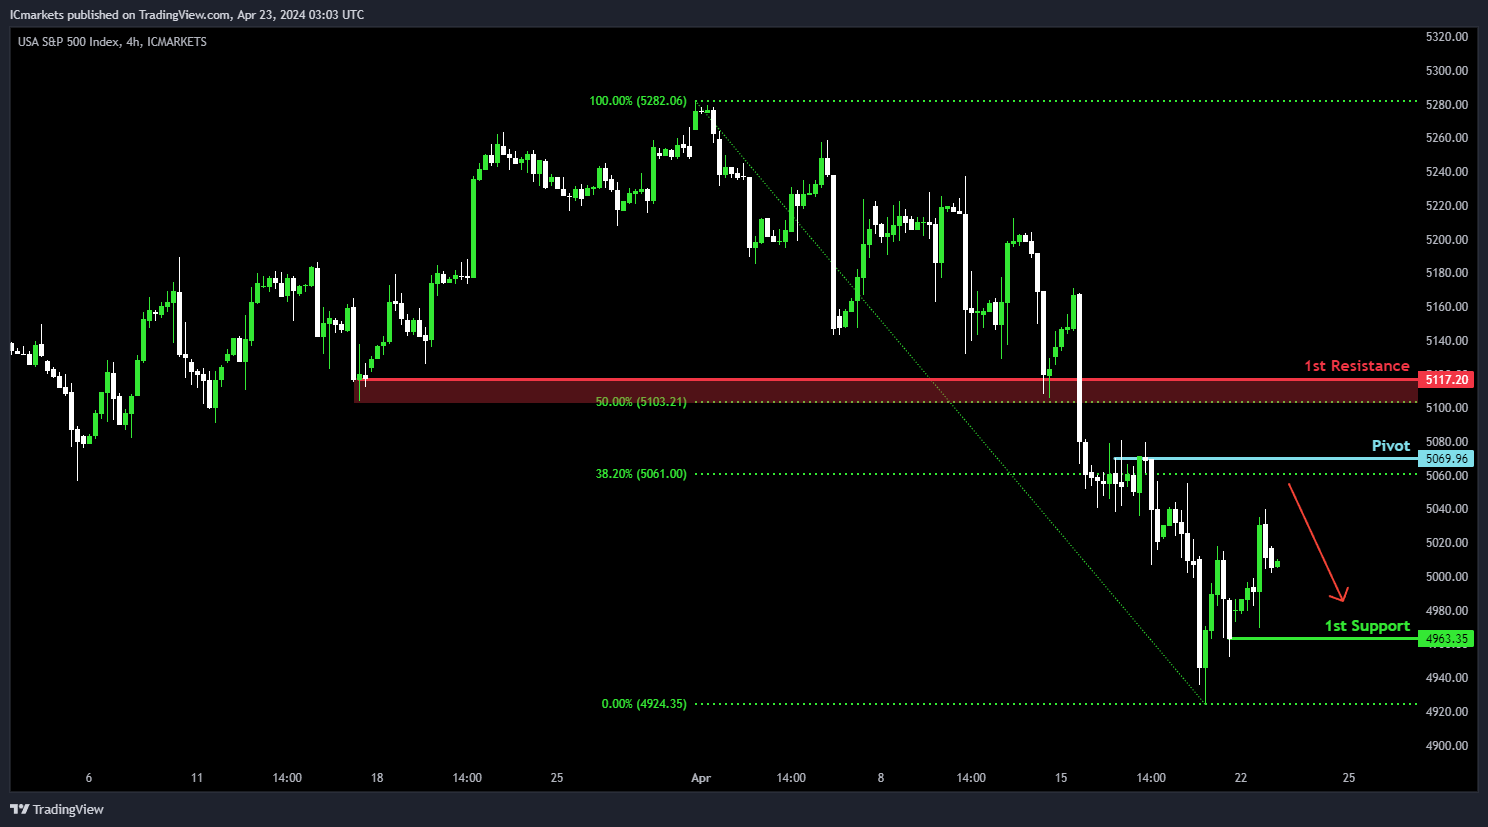
 US500 (S&P 500):
Potential Direction: Bearish
Overall momentum of the chart: Neutral
Price could rise towards the pivot and potentially make a bearish reaction off this level to drop towards the 1st support
Pivot: 5,069.96
Supporting reasons: Acts as a pullback support that aligns close to a 38.2% Fibonacci retracement level, suggesting a significant area where price has previously faced strong selling pressures and could stall around this level before reversing to drop lower.
1st support: 4,963.35
Supporting reasons: Acts as a pullback support, suggesting a significant area where price has previously found strong buying interest and could provide a solid foundation to halt further downward movement.
1st resistance: 5,117.20
Supporting reasons: Marked by a pullback resistance that aligns close to a 50% Fibonacci retracement level, which could function as a potential barrier and cap any upward movements.
US500 (S&P 500):
Potential Direction: Bearish
Overall momentum of the chart: Neutral
Price could rise towards the pivot and potentially make a bearish reaction off this level to drop towards the 1st support
Pivot: 5,069.96
Supporting reasons: Acts as a pullback support that aligns close to a 38.2% Fibonacci retracement level, suggesting a significant area where price has previously faced strong selling pressures and could stall around this level before reversing to drop lower.
1st support: 4,963.35
Supporting reasons: Acts as a pullback support, suggesting a significant area where price has previously found strong buying interest and could provide a solid foundation to halt further downward movement.
1st resistance: 5,117.20
Supporting reasons: Marked by a pullback resistance that aligns close to a 50% Fibonacci retracement level, which could function as a potential barrier and cap any upward movements.
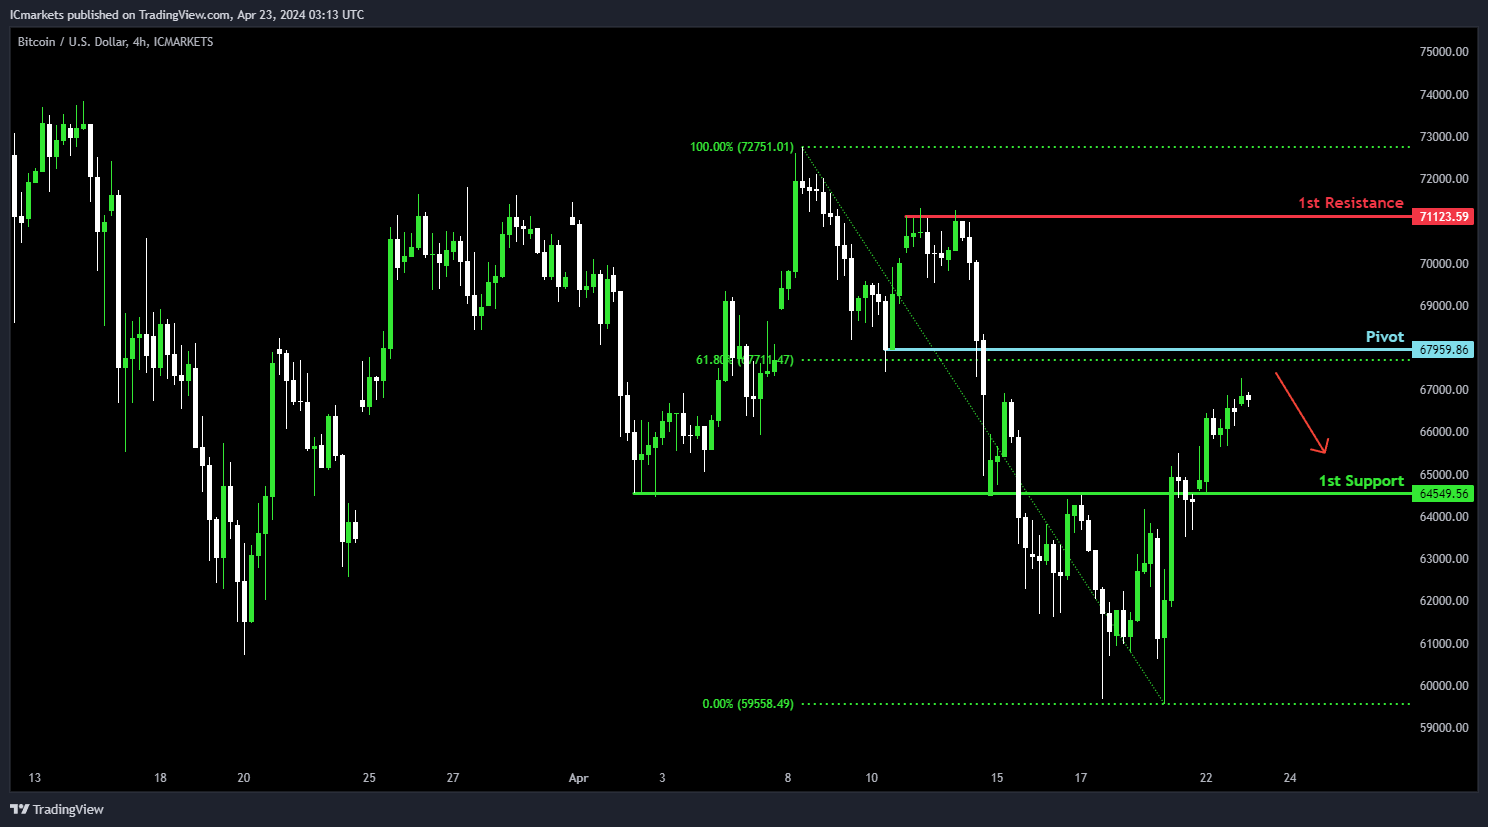
 BTC/USD (Bitcoin):
Potential Direction: Bearish
Overall momentum of the chart: Neutral
Price could rise towards the pivot and potentially make a bearish reaction off this level to drop towards the 1st support
Pivot: 67,959.86
Supporting reasons: Acts as a pullback support that aligns with a 61.8% Fibonacci retracement level, suggesting a significant area where price could face strong selling pressures and potentially stall around this level before reversing to drop lower.
1st support: 64,549.56
Supporting reasons: Acts as an overlap support, suggesting a significant area where price has previously found support and could provide a strong foundation to halt further downward movements.
1st resistance: 71,123.59
Supporting reasons: Marked by a pullback resistance, indicating a significant barrier that could cap further upward movements.
BTC/USD (Bitcoin):
Potential Direction: Bearish
Overall momentum of the chart: Neutral
Price could rise towards the pivot and potentially make a bearish reaction off this level to drop towards the 1st support
Pivot: 67,959.86
Supporting reasons: Acts as a pullback support that aligns with a 61.8% Fibonacci retracement level, suggesting a significant area where price could face strong selling pressures and potentially stall around this level before reversing to drop lower.
1st support: 64,549.56
Supporting reasons: Acts as an overlap support, suggesting a significant area where price has previously found support and could provide a strong foundation to halt further downward movements.
1st resistance: 71,123.59
Supporting reasons: Marked by a pullback resistance, indicating a significant barrier that could cap further upward movements.
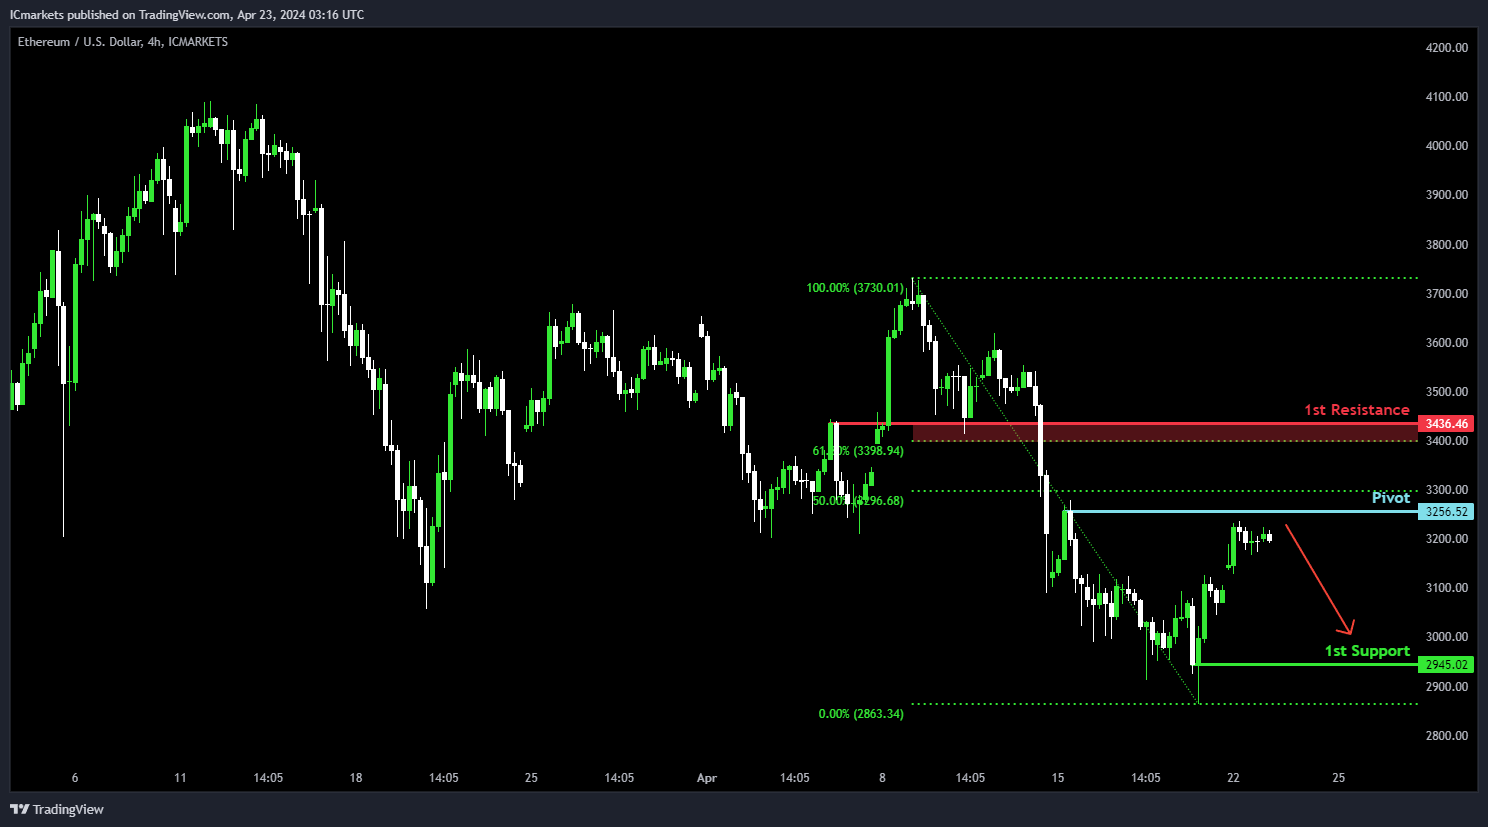
 ETH/USD (Ethereum):
Potential Direction: Bearish
Overall momentum of the chart: Neutral
Price could rise towards the pivot and potentially make a bearish reaction off this level to drop towards the 1st support
Pivot: 3,256.52
Supporting reasons: Acts as a pullback support that aligns close to a 50% Fibonacci retracement level, suggesting a significant area where price could face strong selling pressures and potentially stall around this level before reversing to drop lower.
1st support: 2,945.02
Supporting reasons: Identified as a pullback support, suggesting a significant area where price has previously found support and could provide a strong foundation to halt further downward movements.
1st resistance: 3,436.46
Supporting reasons: Identified as an overlap resistance that aligns close to a 61.8% Fibonacci retracement level, marking a significant barrier that could cap further upward movements.
ETH/USD (Ethereum):
Potential Direction: Bearish
Overall momentum of the chart: Neutral
Price could rise towards the pivot and potentially make a bearish reaction off this level to drop towards the 1st support
Pivot: 3,256.52
Supporting reasons: Acts as a pullback support that aligns close to a 50% Fibonacci retracement level, suggesting a significant area where price could face strong selling pressures and potentially stall around this level before reversing to drop lower.
1st support: 2,945.02
Supporting reasons: Identified as a pullback support, suggesting a significant area where price has previously found support and could provide a strong foundation to halt further downward movements.
1st resistance: 3,436.46
Supporting reasons: Identified as an overlap resistance that aligns close to a 61.8% Fibonacci retracement level, marking a significant barrier that could cap further upward movements.
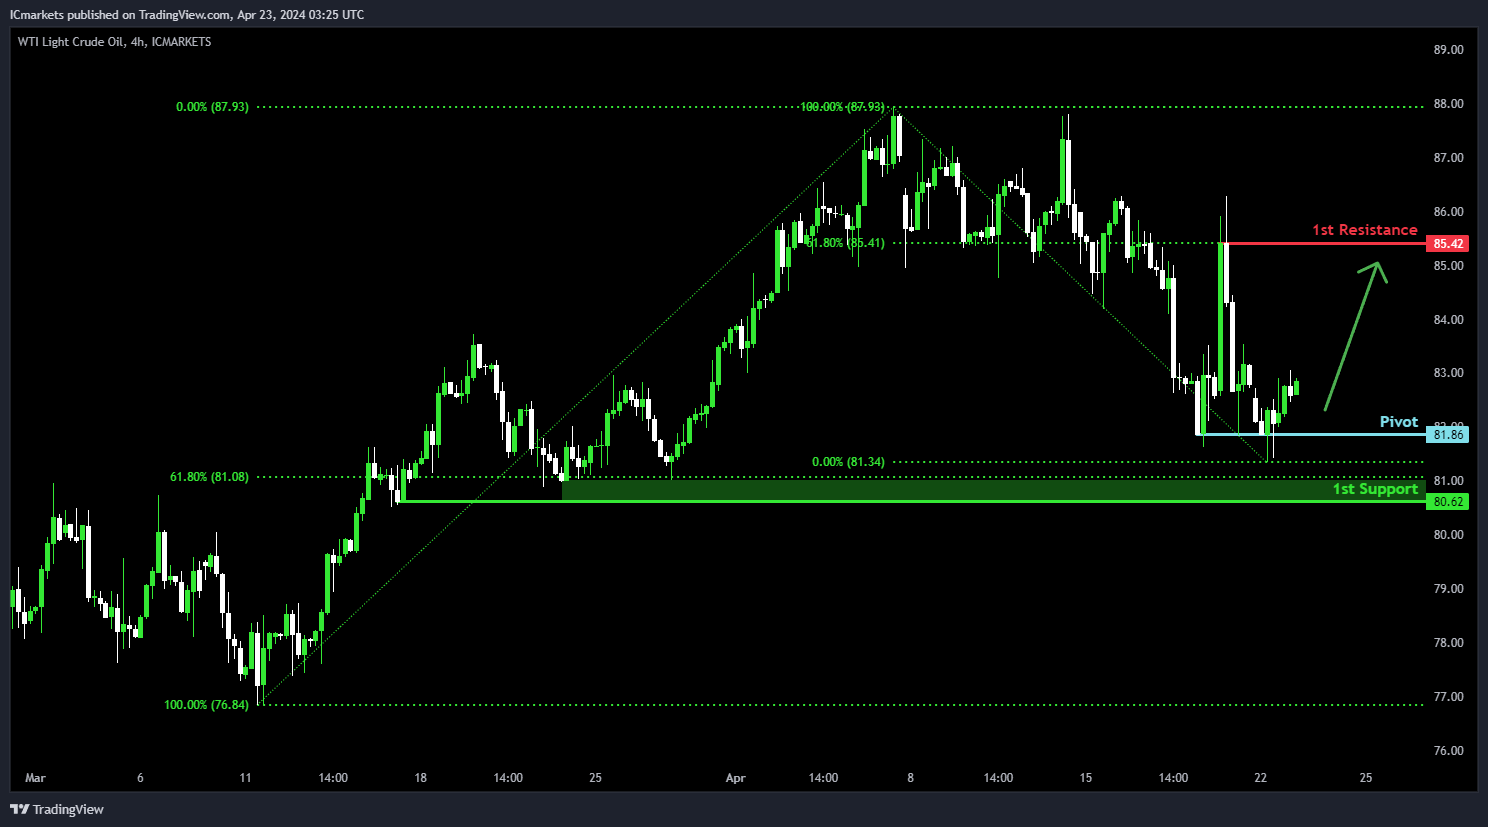
 WTI/USD (Oil):
Potential Direction: Bullish
Overall momentum of the chart: Neutral
Price has made a bullish reaction off the pivot and could potentially rise towards the 1st resistance
Pivot: 81.86
Supporting reasons: Acts as a pullback support, suggesting a significant area where price has previously found support to provide a strong foundation for a potential rebound.
1st support: 80.62
Supporting reasons: Identified as a pullback support that aligns close to a 61.8% Fibonacci retracement level, suggesting a significant area where price has previously found strong buying interest and could provide a solid foundation to halt further downward movements.
1st resistance: 85.42
Supporting reasons: Identified as a pullback resistance that aligns with a 61.8% Fibonacci retracement level, marking a significant barrier that could cap further upward movements.
WTI/USD (Oil):
Potential Direction: Bullish
Overall momentum of the chart: Neutral
Price has made a bullish reaction off the pivot and could potentially rise towards the 1st resistance
Pivot: 81.86
Supporting reasons: Acts as a pullback support, suggesting a significant area where price has previously found support to provide a strong foundation for a potential rebound.
1st support: 80.62
Supporting reasons: Identified as a pullback support that aligns close to a 61.8% Fibonacci retracement level, suggesting a significant area where price has previously found strong buying interest and could provide a solid foundation to halt further downward movements.
1st resistance: 85.42
Supporting reasons: Identified as a pullback resistance that aligns with a 61.8% Fibonacci retracement level, marking a significant barrier that could cap further upward movements.
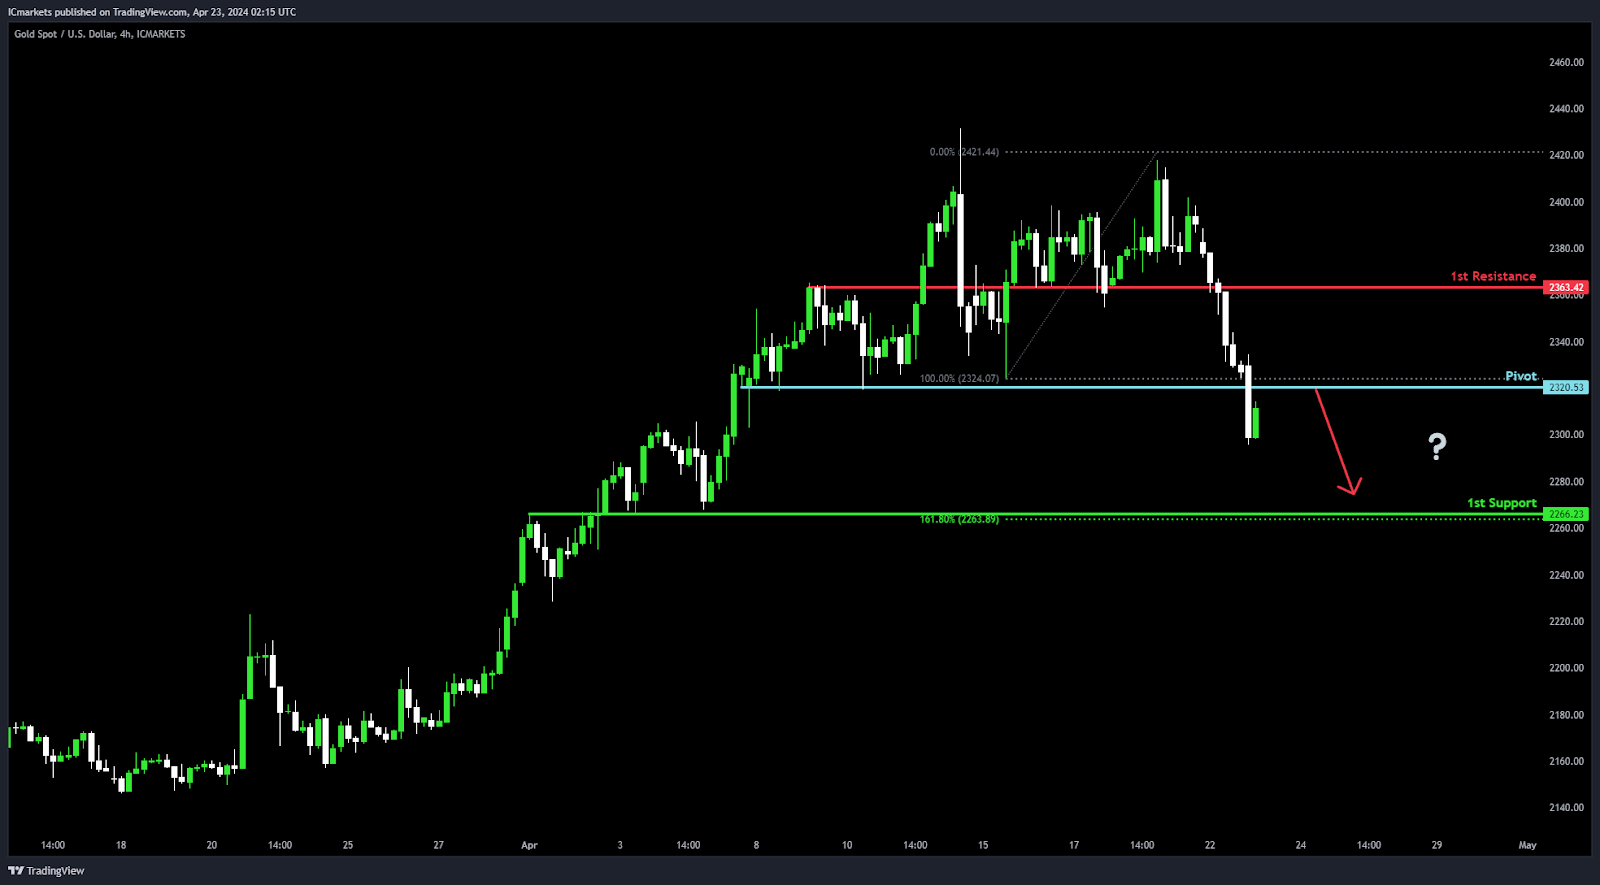
 XAU/USD (GOLD):
Potential Direction: Bearish
Overall momentum of the chart: Bearish
Price could potentially make a bearish reaction off pivot and drop to 1st support.
PIvot: 2320.00
Supporting reasons: Pullback support, indicating a level where buyers might intervene to support the price, potentially providing a foundation for a bounce or temporary halt in the bearish momentum.
1st support: 2266.00
Supporting reasons: An Overlap support, suggesting a significant level where buyers have previously stepped in to support the price, potentially acting as a strong support zone.
1st resistance: 2363.00
Supporting reasons: Pullback resistance, representing a level where selling pressure might intensify, potentially acting as a barrier to further upward movement within the context of the overall bearish trend.
XAU/USD (GOLD):
Potential Direction: Bearish
Overall momentum of the chart: Bearish
Price could potentially make a bearish reaction off pivot and drop to 1st support.
PIvot: 2320.00
Supporting reasons: Pullback support, indicating a level where buyers might intervene to support the price, potentially providing a foundation for a bounce or temporary halt in the bearish momentum.
1st support: 2266.00
Supporting reasons: An Overlap support, suggesting a significant level where buyers have previously stepped in to support the price, potentially acting as a strong support zone.
1st resistance: 2363.00
Supporting reasons: Pullback resistance, representing a level where selling pressure might intensify, potentially acting as a barrier to further upward movement within the context of the overall bearish trend.
 The accuracy, completeness and timeliness of the information contained on this site cannot be guaranteed. IC Markets does not warranty, guarantee or make any representations, or assume any liability regarding financial results based on the use of the information in the site.
News, views, opinions, recommendations and other information obtained from sources outside of www.icmarkets.com, used in this site are believed to be reliable, but we cannot guarantee their accuracy or completeness. All such information is subject to change at any time without notice. IC Markets assumes no responsibility for the content of any linked site.
The fact that such links may exist does not indicate approval or endorsement of any material contained on any linked site. IC Markets is not liable for any harm caused by the transmission, through accessing the services or information on this site, of a computer virus, or other computer code or programming device that might be used to access, delete, damage, disable, disrupt or otherwise impede in any manner, the operation of the site or of any user’s software, hardware, data or property.
The accuracy, completeness and timeliness of the information contained on this site cannot be guaranteed. IC Markets does not warranty, guarantee or make any representations, or assume any liability regarding financial results based on the use of the information in the site.
News, views, opinions, recommendations and other information obtained from sources outside of www.icmarkets.com, used in this site are believed to be reliable, but we cannot guarantee their accuracy or completeness. All such information is subject to change at any time without notice. IC Markets assumes no responsibility for the content of any linked site.
The fact that such links may exist does not indicate approval or endorsement of any material contained on any linked site. IC Markets is not liable for any harm caused by the transmission, through accessing the services or information on this site, of a computer virus, or other computer code or programming device that might be used to access, delete, damage, disable, disrupt or otherwise impede in any manner, the operation of the site or of any user’s software, hardware, data or property. Disclaimer:
Raw Trading Ltd is regulated by the Seychelles Financial Services Authority (FSA) with Securities Dealer’s license number SD018.
Risk Warning: Trading Forex and CFDs carries a high level of risk to your capital and you should only trade with money you can afford to lose. Trading Forex and CFDs may not be suitable for all investors, so please ensure that you fully understand the risks involved and seek independent advice if necessary. Please read and ensure you fully understand our Risk Disclosure.
Restricted Countries: Raw Trading Ltd does not provide services for residents of certain countries such as the United States of America, Canada, Israel, New Zealand, Iran and North Korea (Democratic People’s Republic of Korea) or a country where such distribution or use would be contrary to local law or regulation.
You must be 18 years old, or of legal age as determined in your country. Upon registering an account with Raw Trading Ltd, you acknowledge that you are registering at your own free will, without solicitation on behalf of Raw Trading Ltd.
Raw Trading Ltd does not direct its website and services to any individual in any country in which the use of its website and services are prohibited by local laws or regulations. When accessing this website from a country in which its use may or may not be prohibited, it is the user’s responsibility to ensure that any use of the website or services adheres to local laws or regulations. Raw Trading Ltd does not affirm that the information on its website is suitable for all jurisdictions.
Publication date:
2024-04-23 17:26:09 (GMT)